Company
Role
Responsibility
Dako
(Side project)
UX designer
Research - interview, usability test
Design - IA, wireframe
Dakodata is an easy-to-use data analysis platform that helps enterprises make better business decisions with simple interaction. In this project, I conducted user interviews and usability tests, helped the company understand more about the new market users, what were their pain points while using Dakodata, and what were the potential opportunities for Dakodata. Based on the research insights, I collaborated with another designers to iterate the upload data and analyze data flow for providing a better user experience for new market users. The result helped the team earn the first contract client.
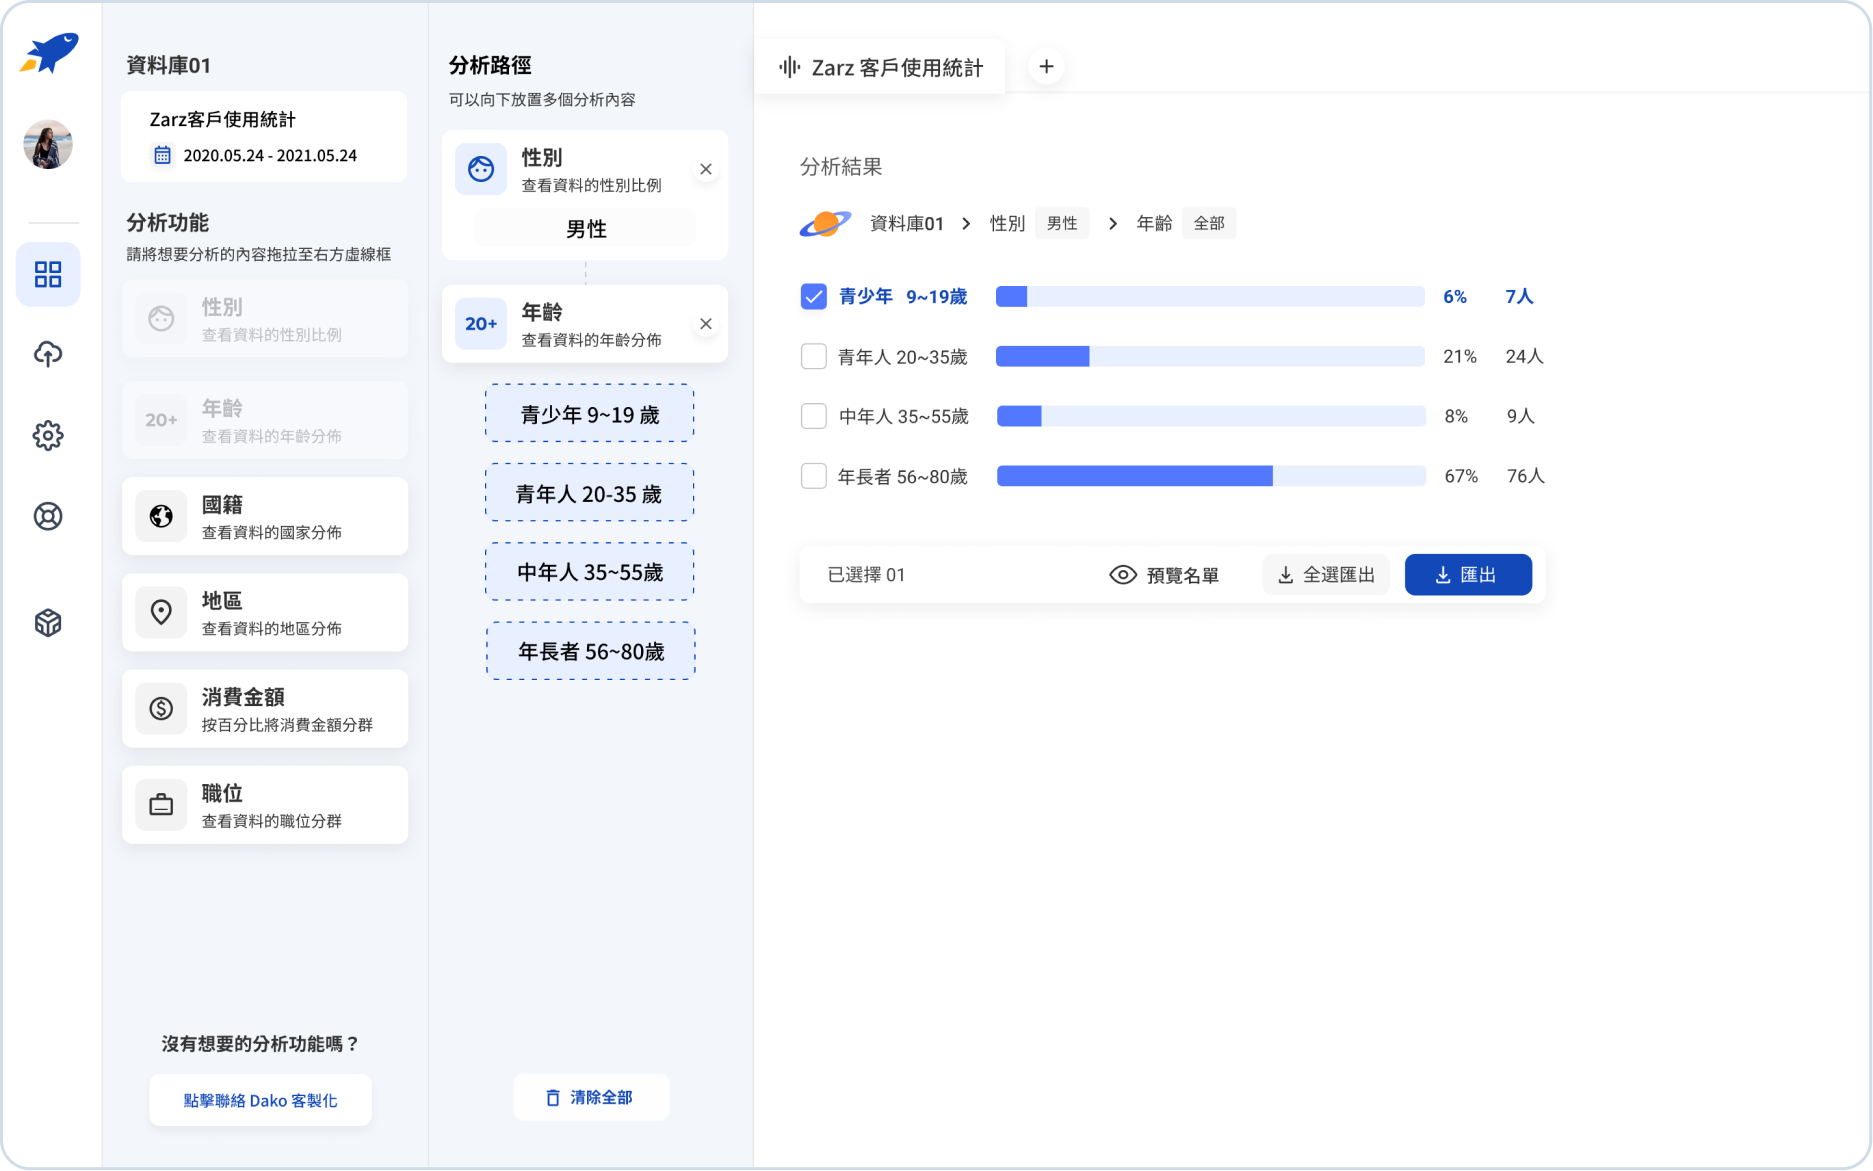
Demo video of "New filters" prototype
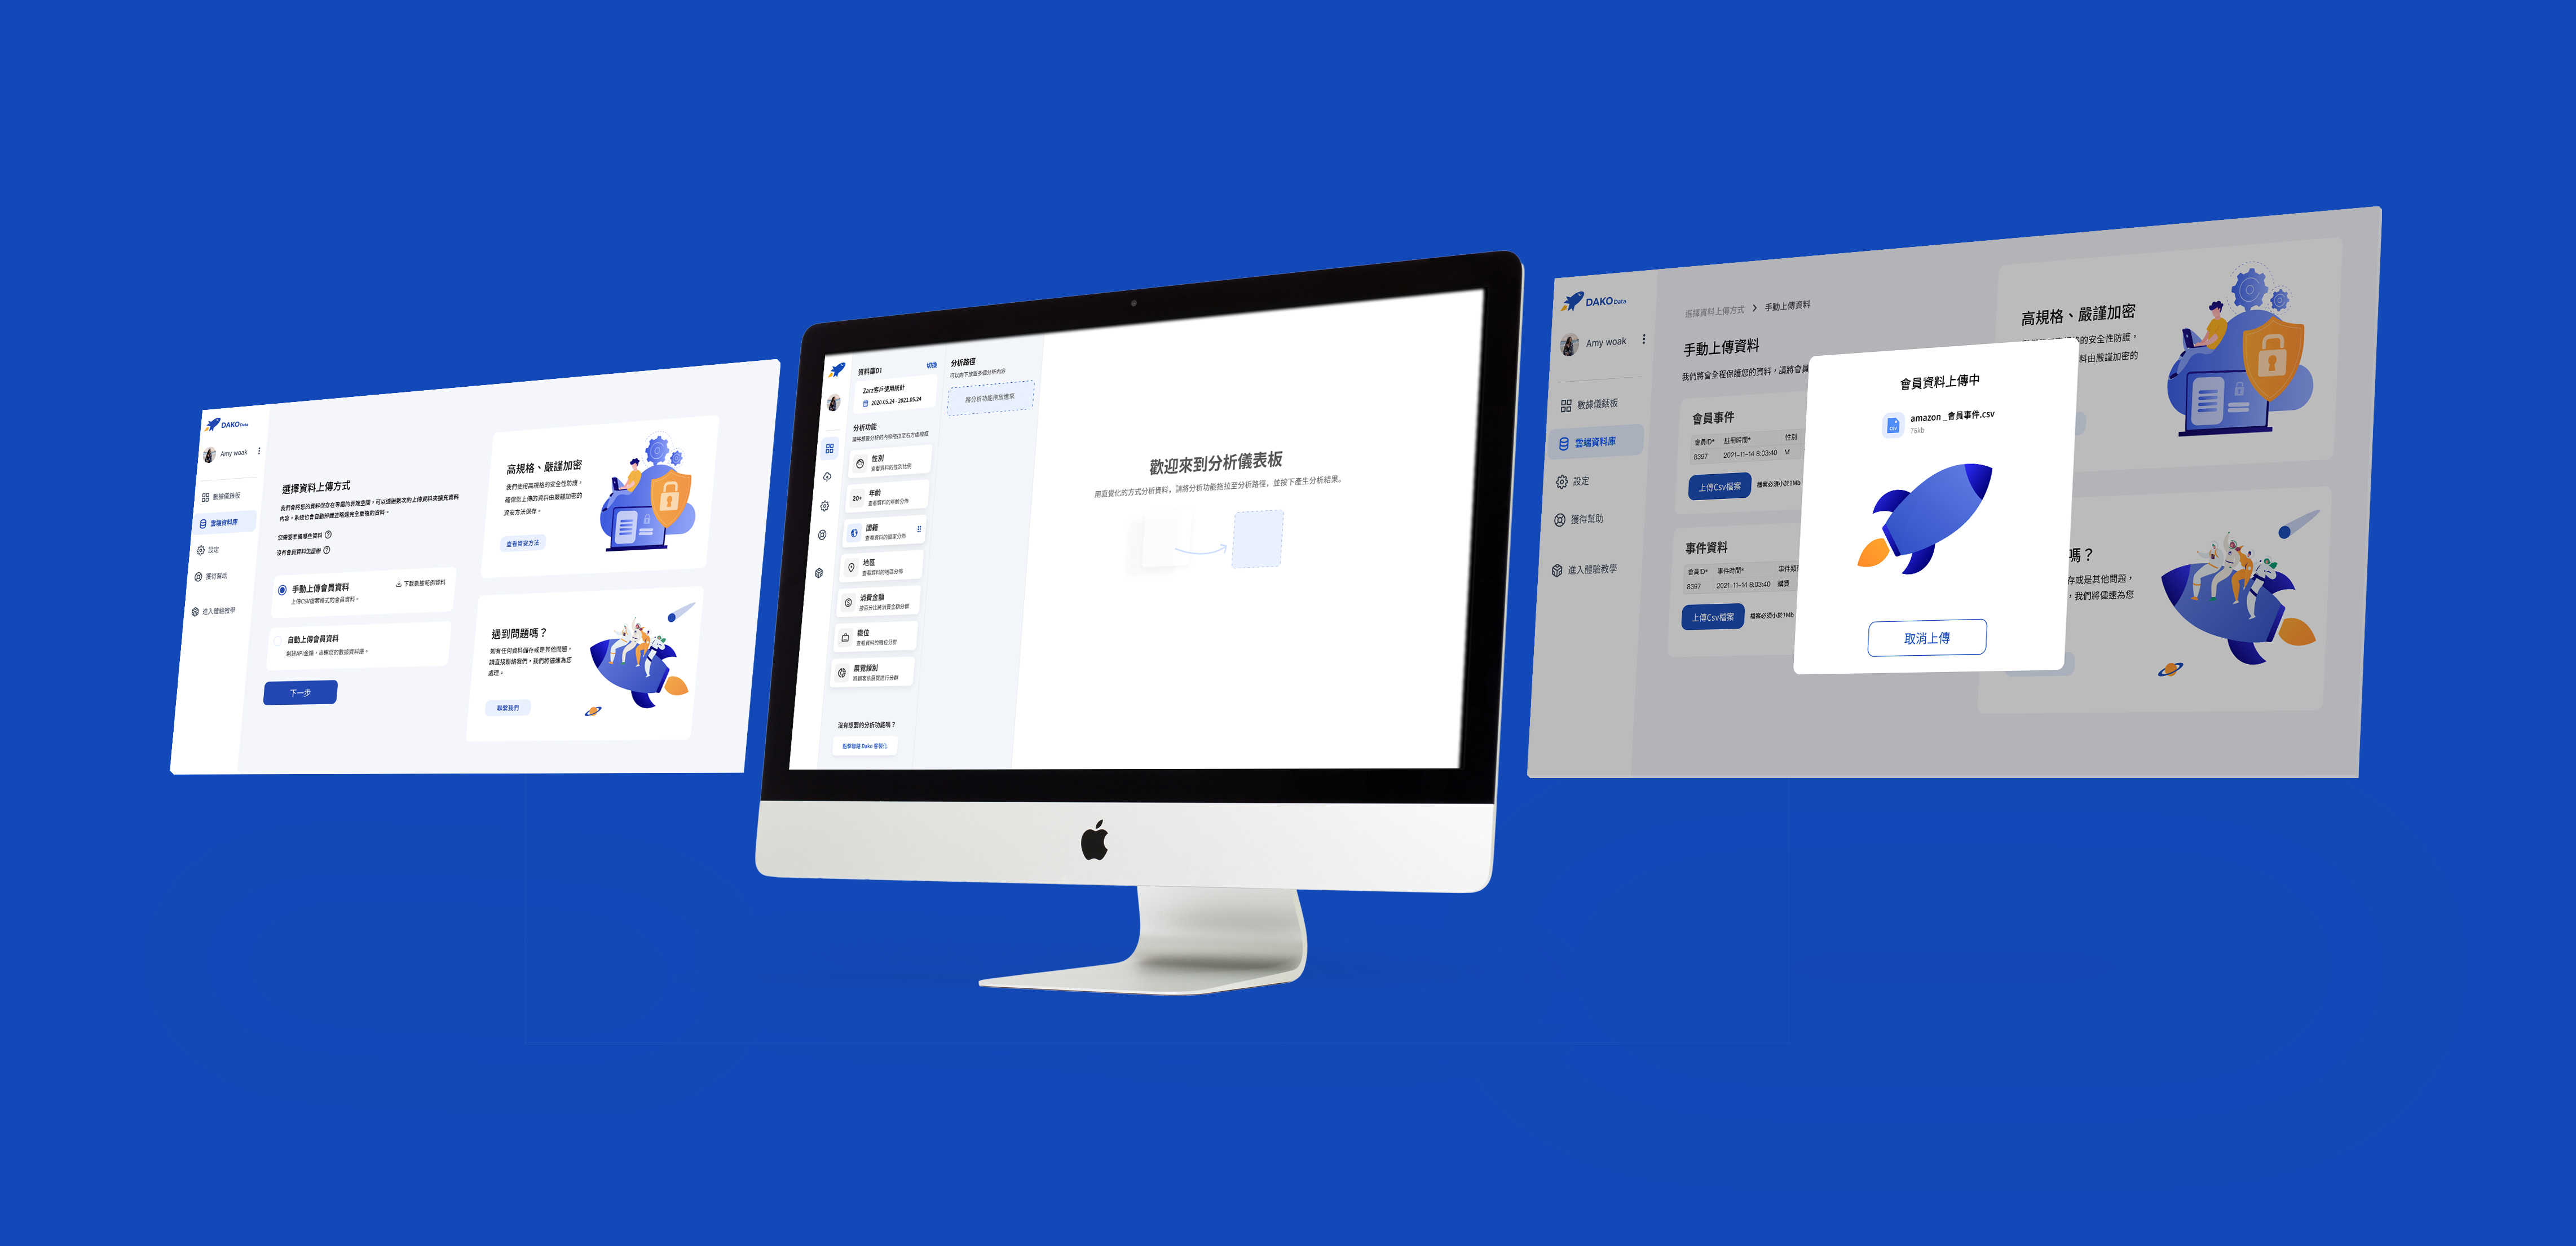
Demo video of "Upload data" prototype
We built Dakodata from 0 to 1, faced pivots, and made quick iterations for survival. Our business model turned to B2B, and the target users were changed to those in the exhibition industry. But the users are different in e-commerce and the exhibition. Moreover, the difference affected the user experience of the new market users.

To understand who were our new users, empathize with their pain points, I conducted user interviews, usability test. In addition, I made persona and user journey map for better communication.
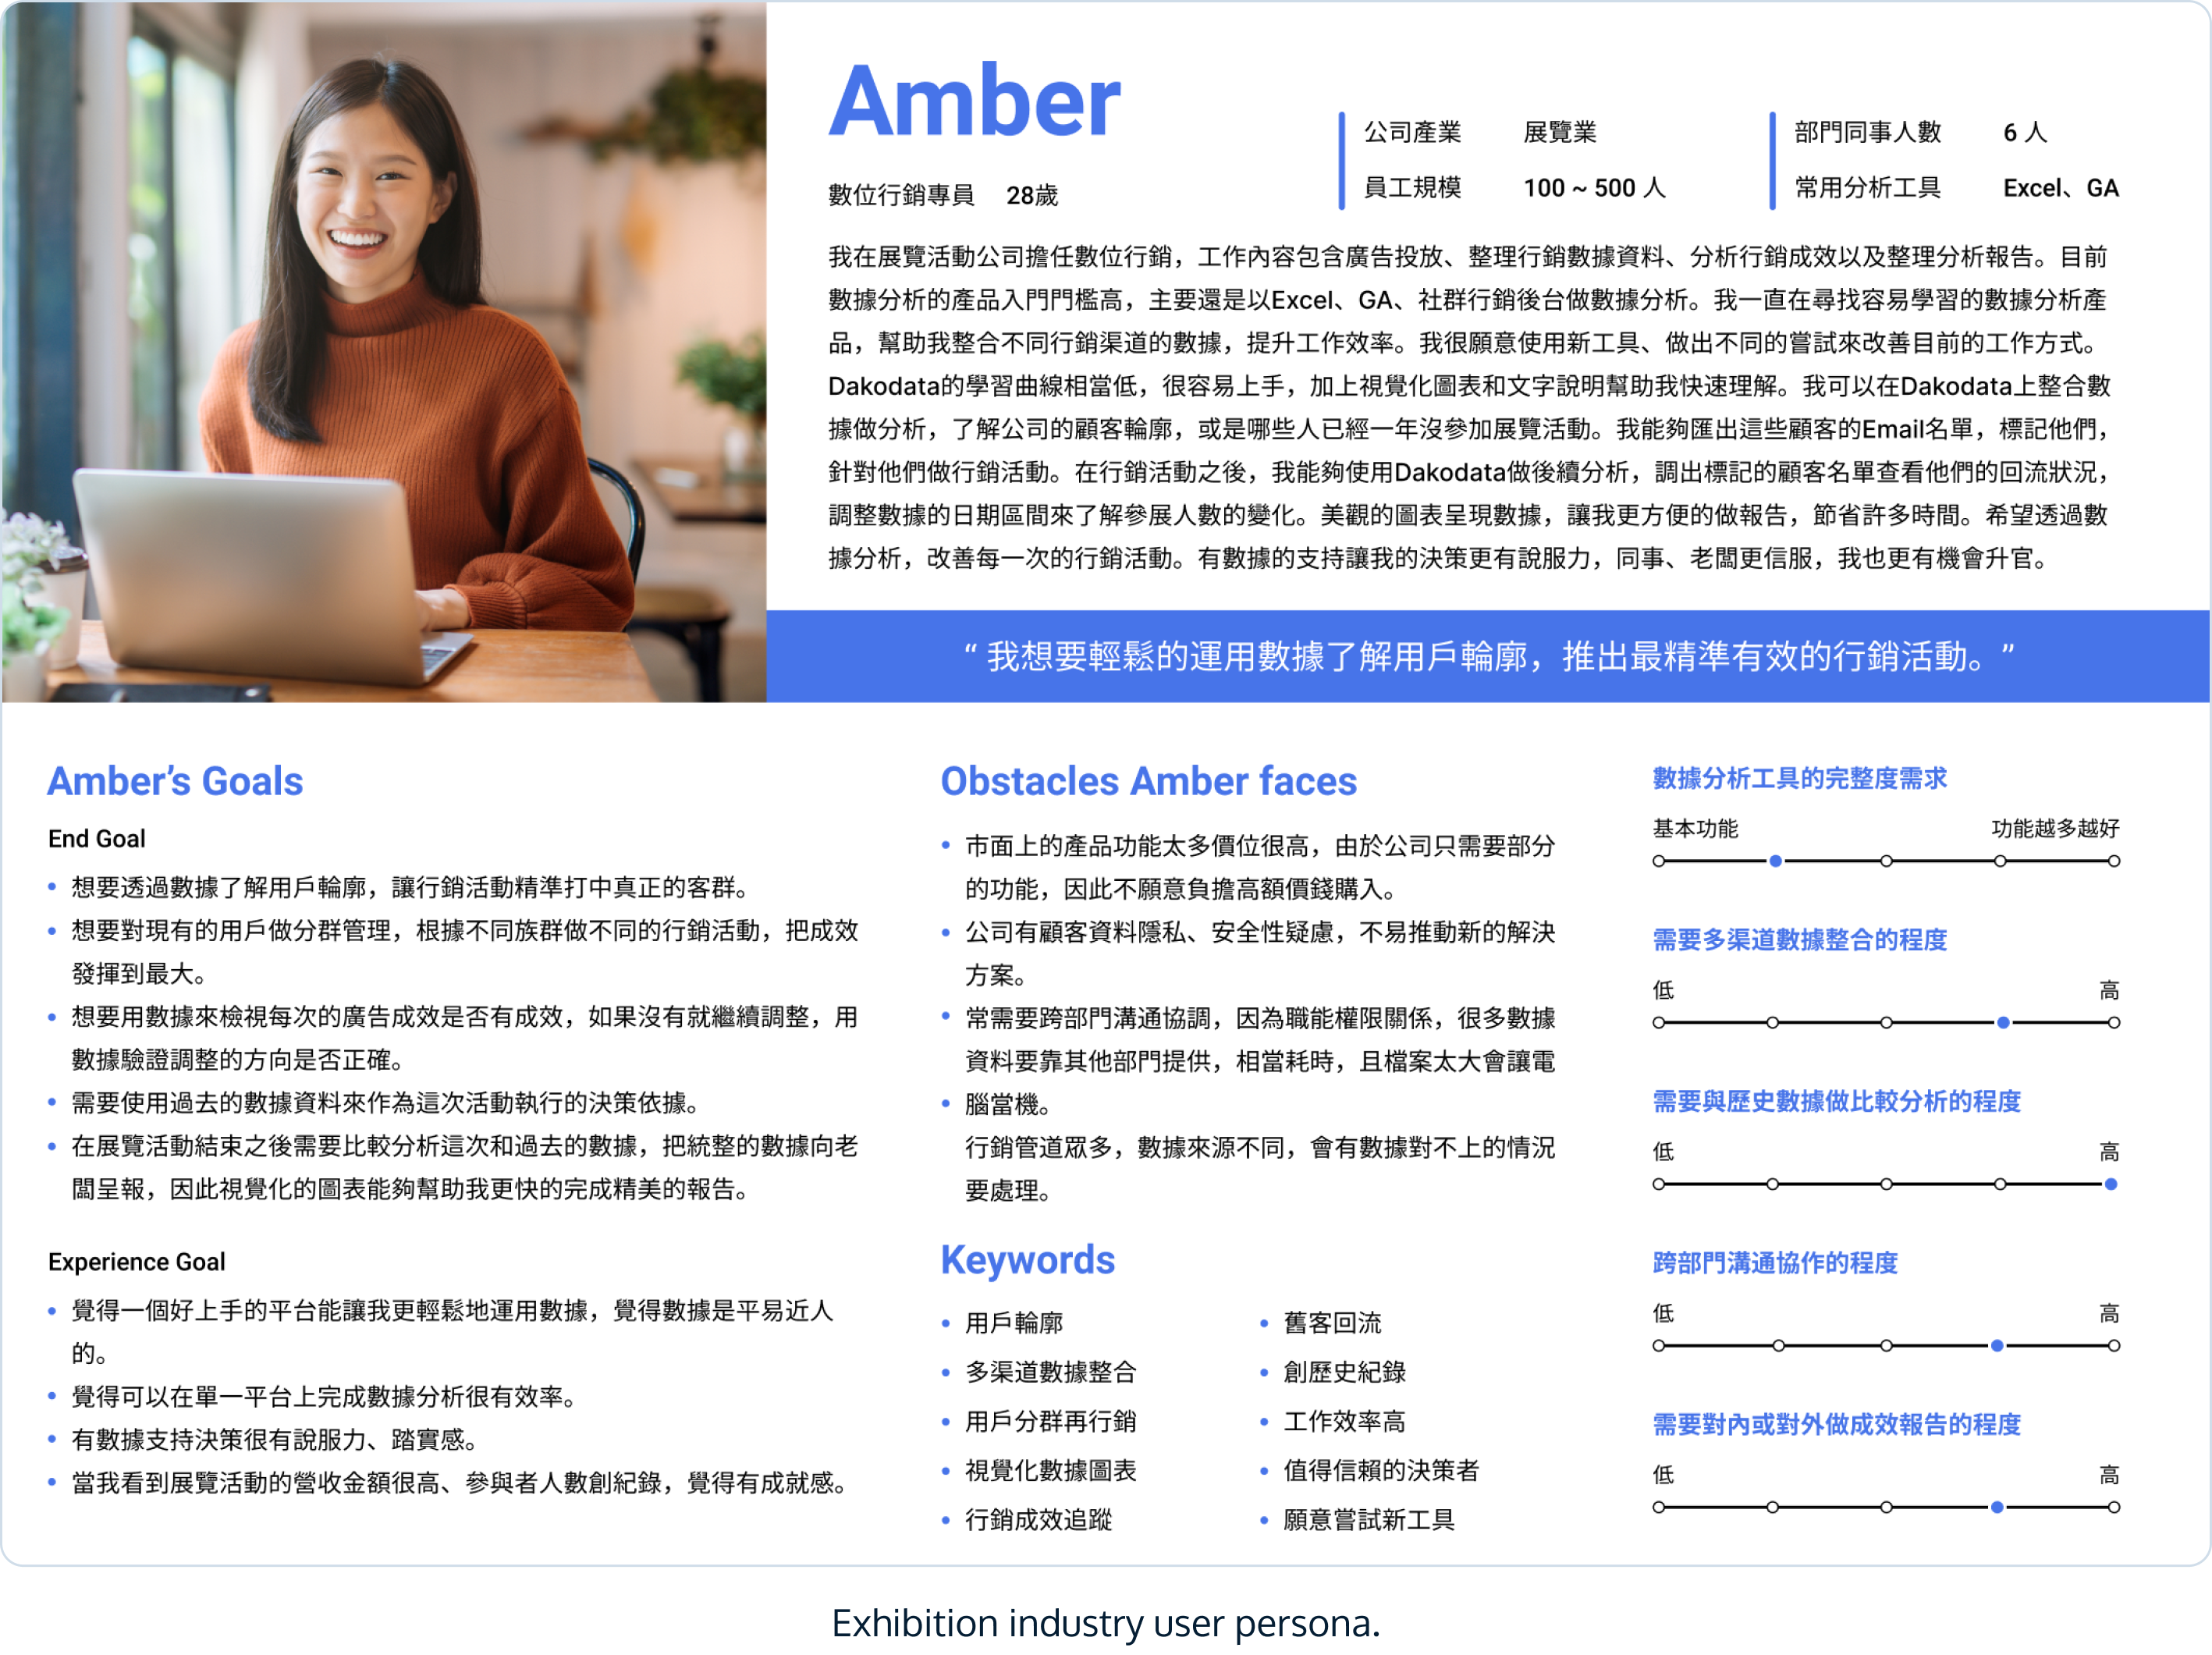
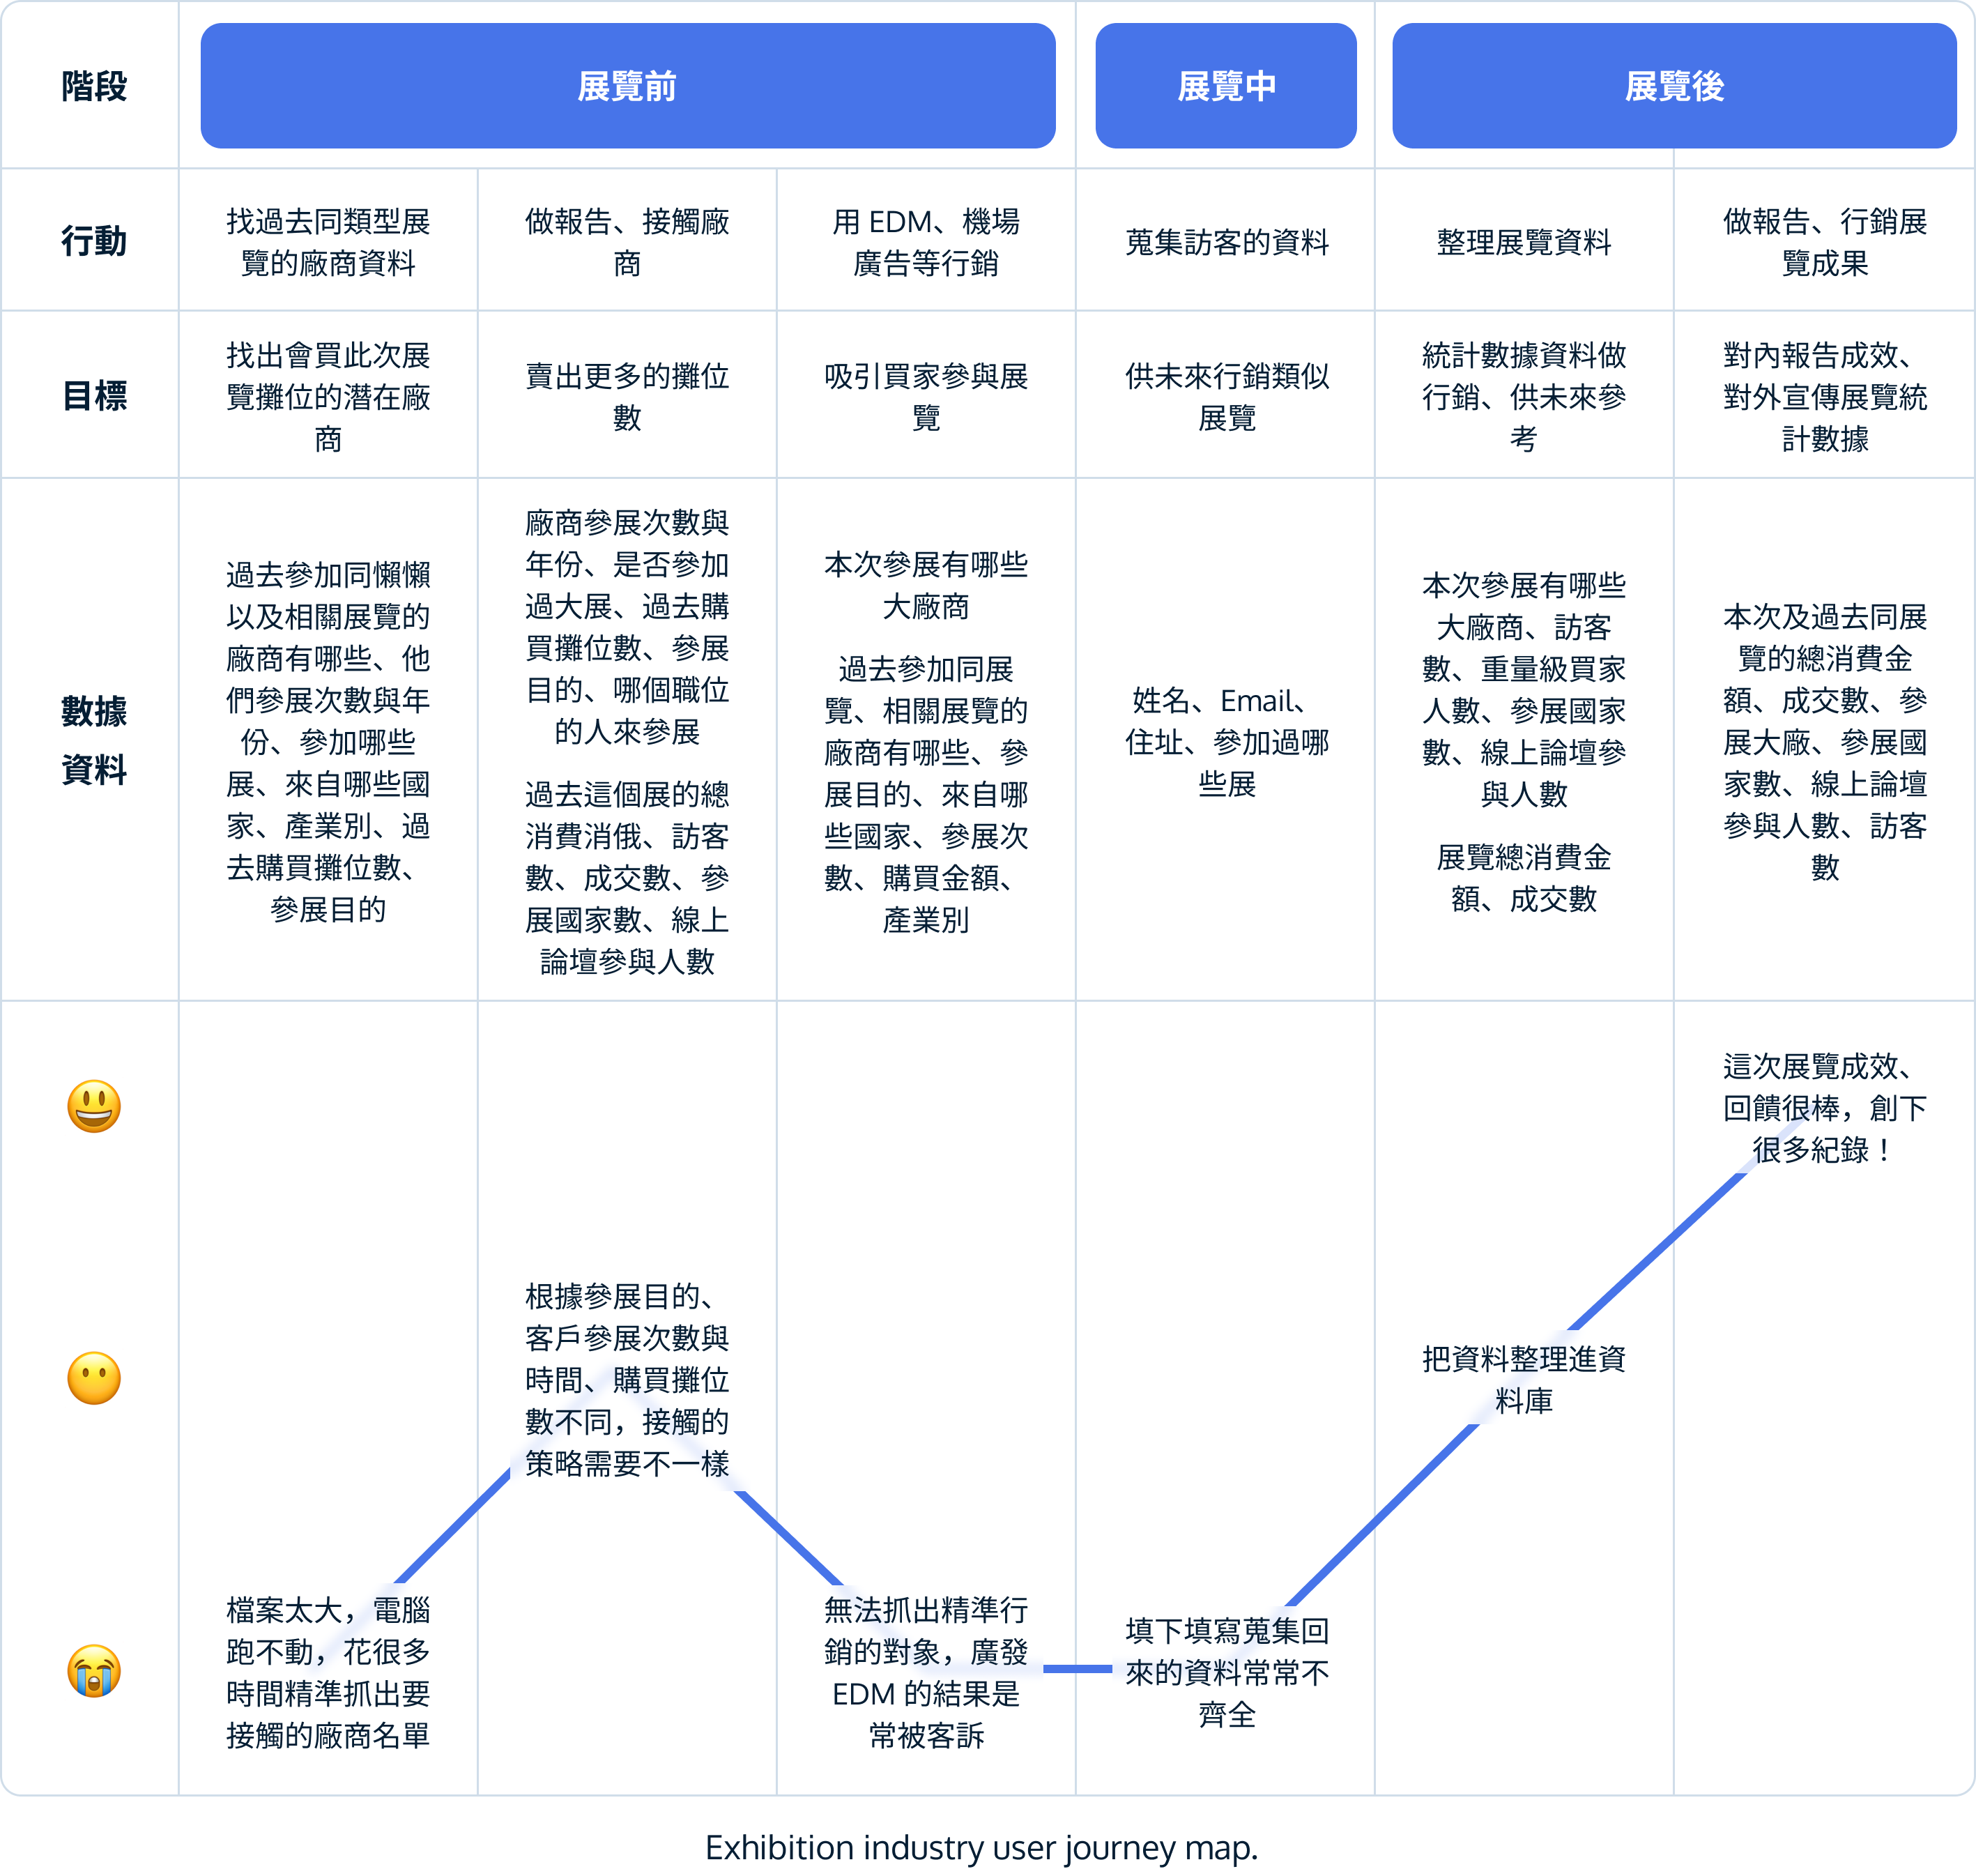
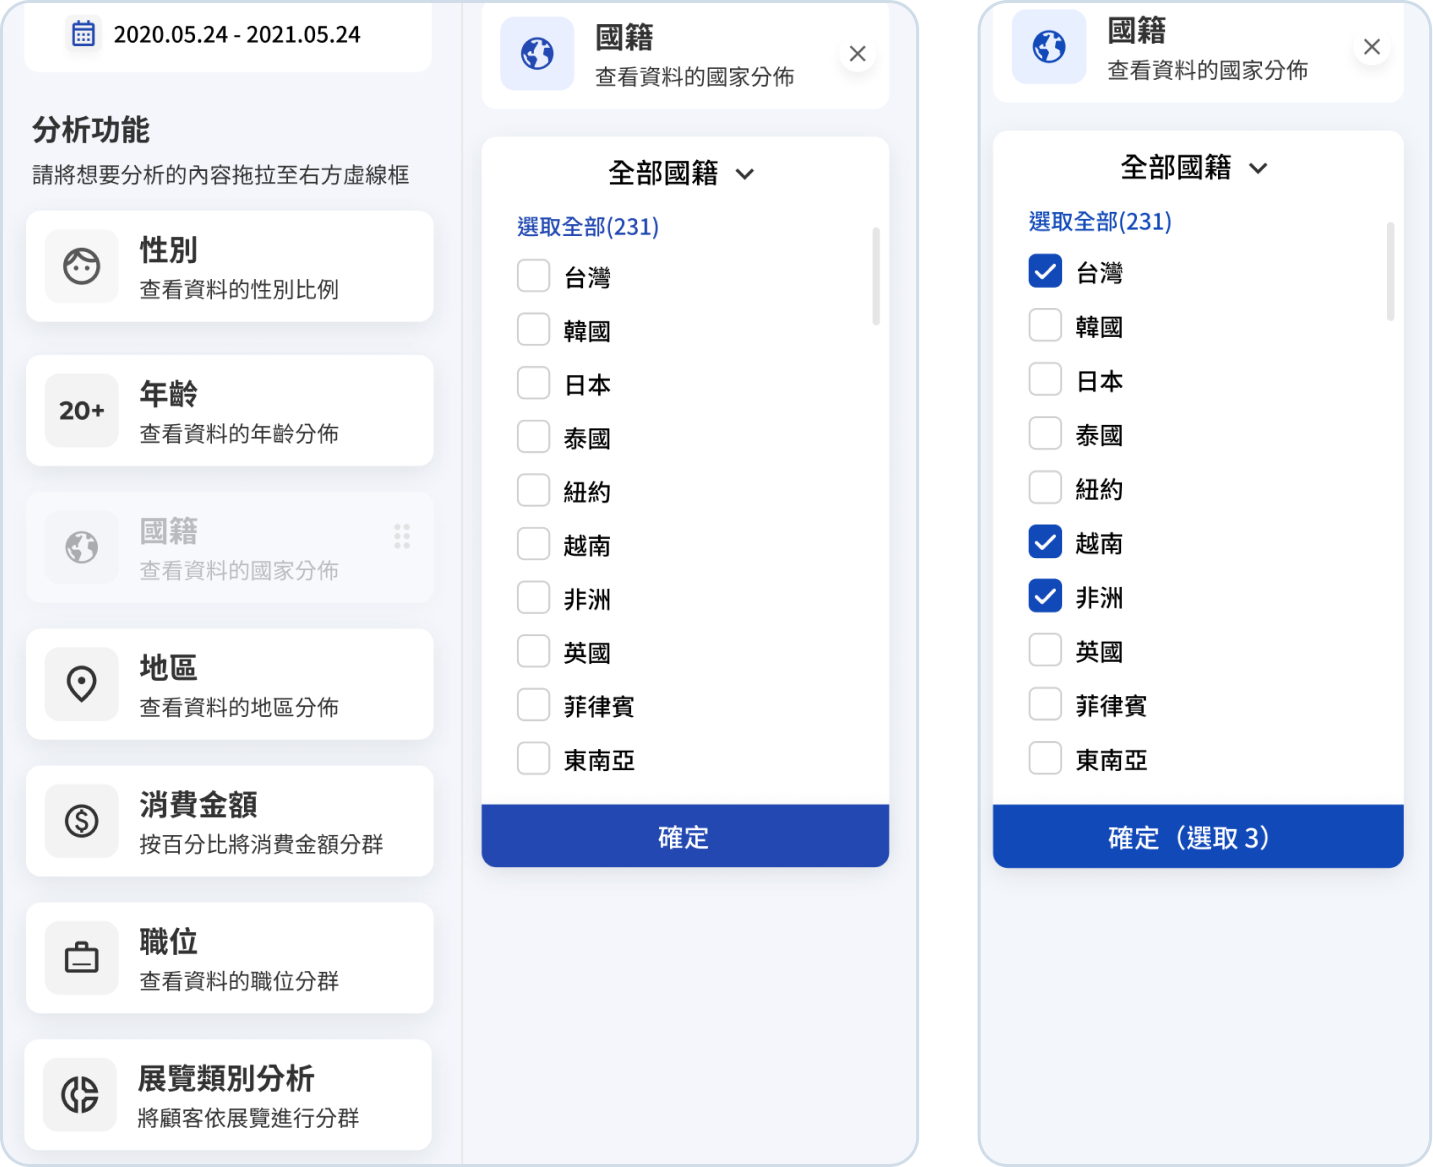
Exhibition industry users wanted to analyze clients’ data by their nationalities, locations, etc., which differs from the e-commerce industry users.
Because data were collected from various channels, users had to clean it before analyzing it with Dakodata.
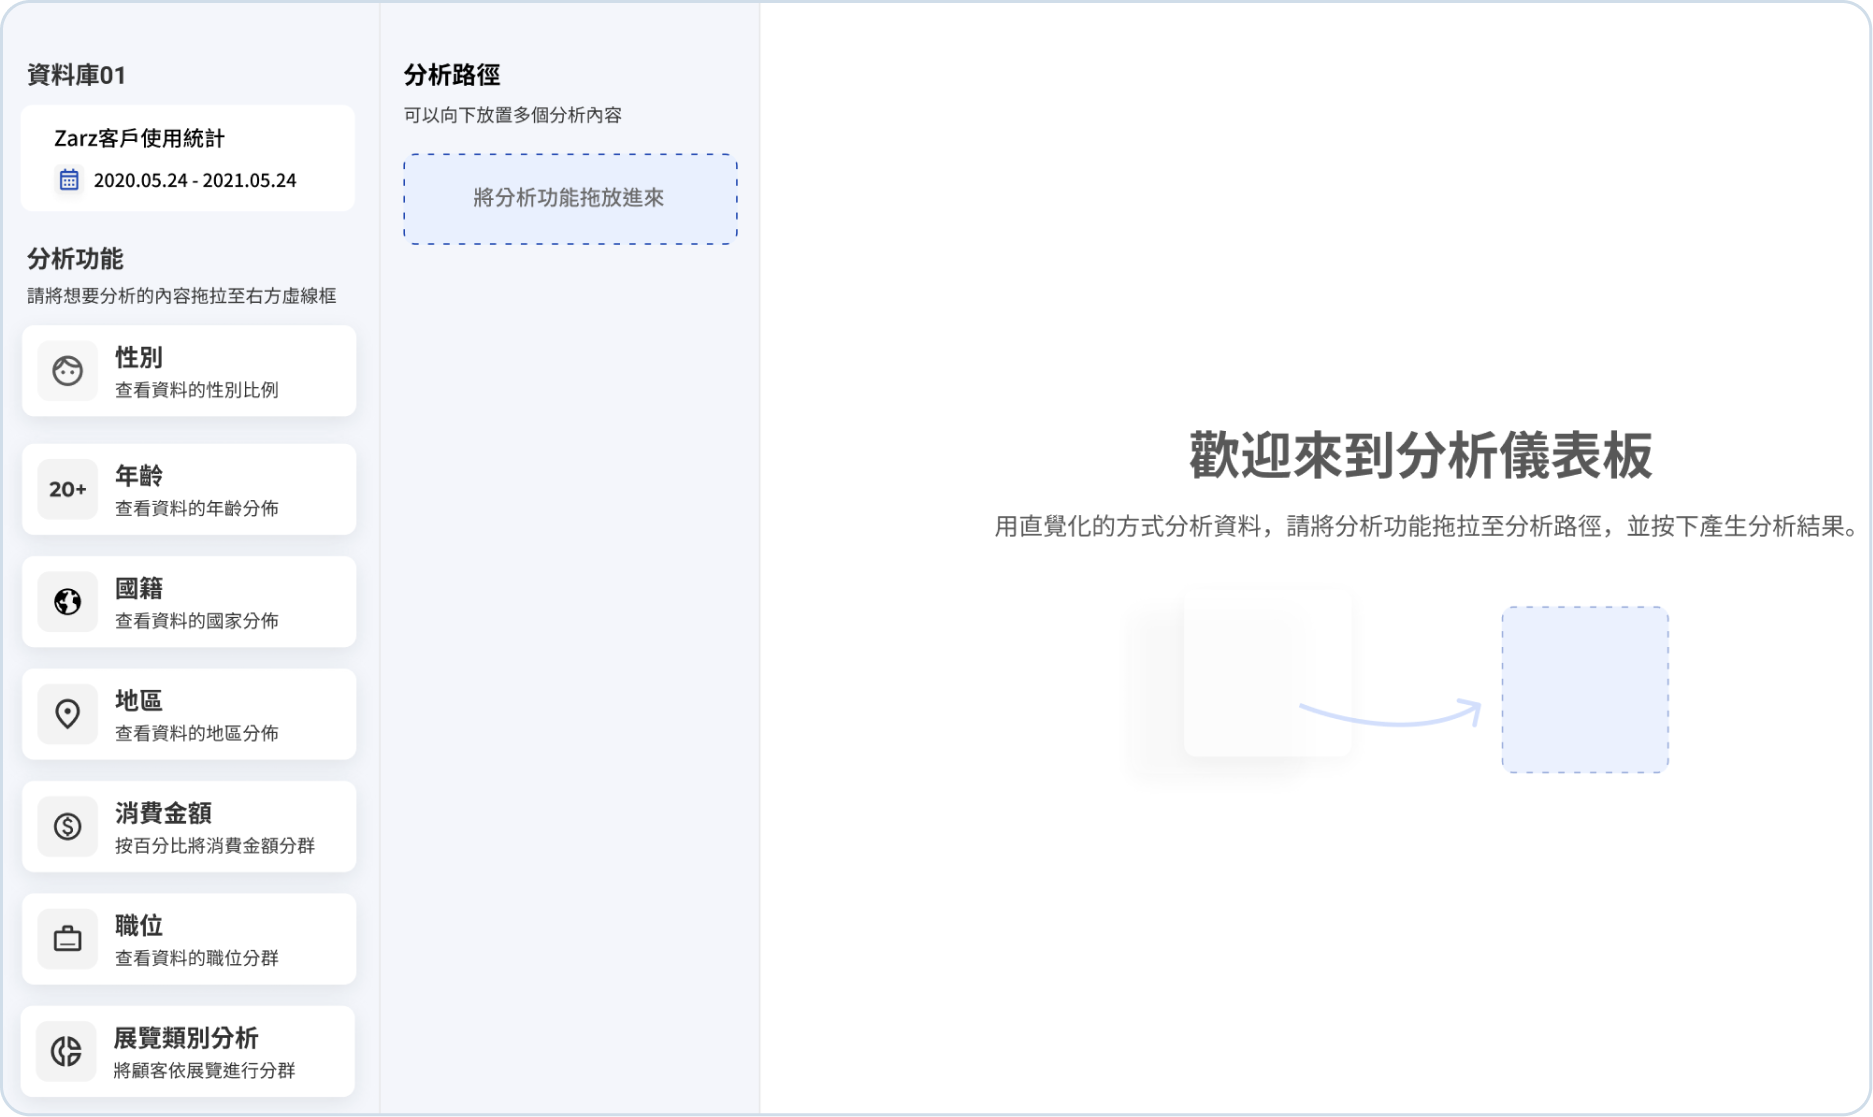
The space utilization of current layout was not efficient enough for the data that might have a lot of results, such as nationality.
After filtering data, users wanted to send email to those clients for marketing.
Users were confused by the wording as they were trying to upload data. They were stuck and didn’t know what to do next. They also had concern on uploading data to Dakodata because it’s a MVP.
Functionality
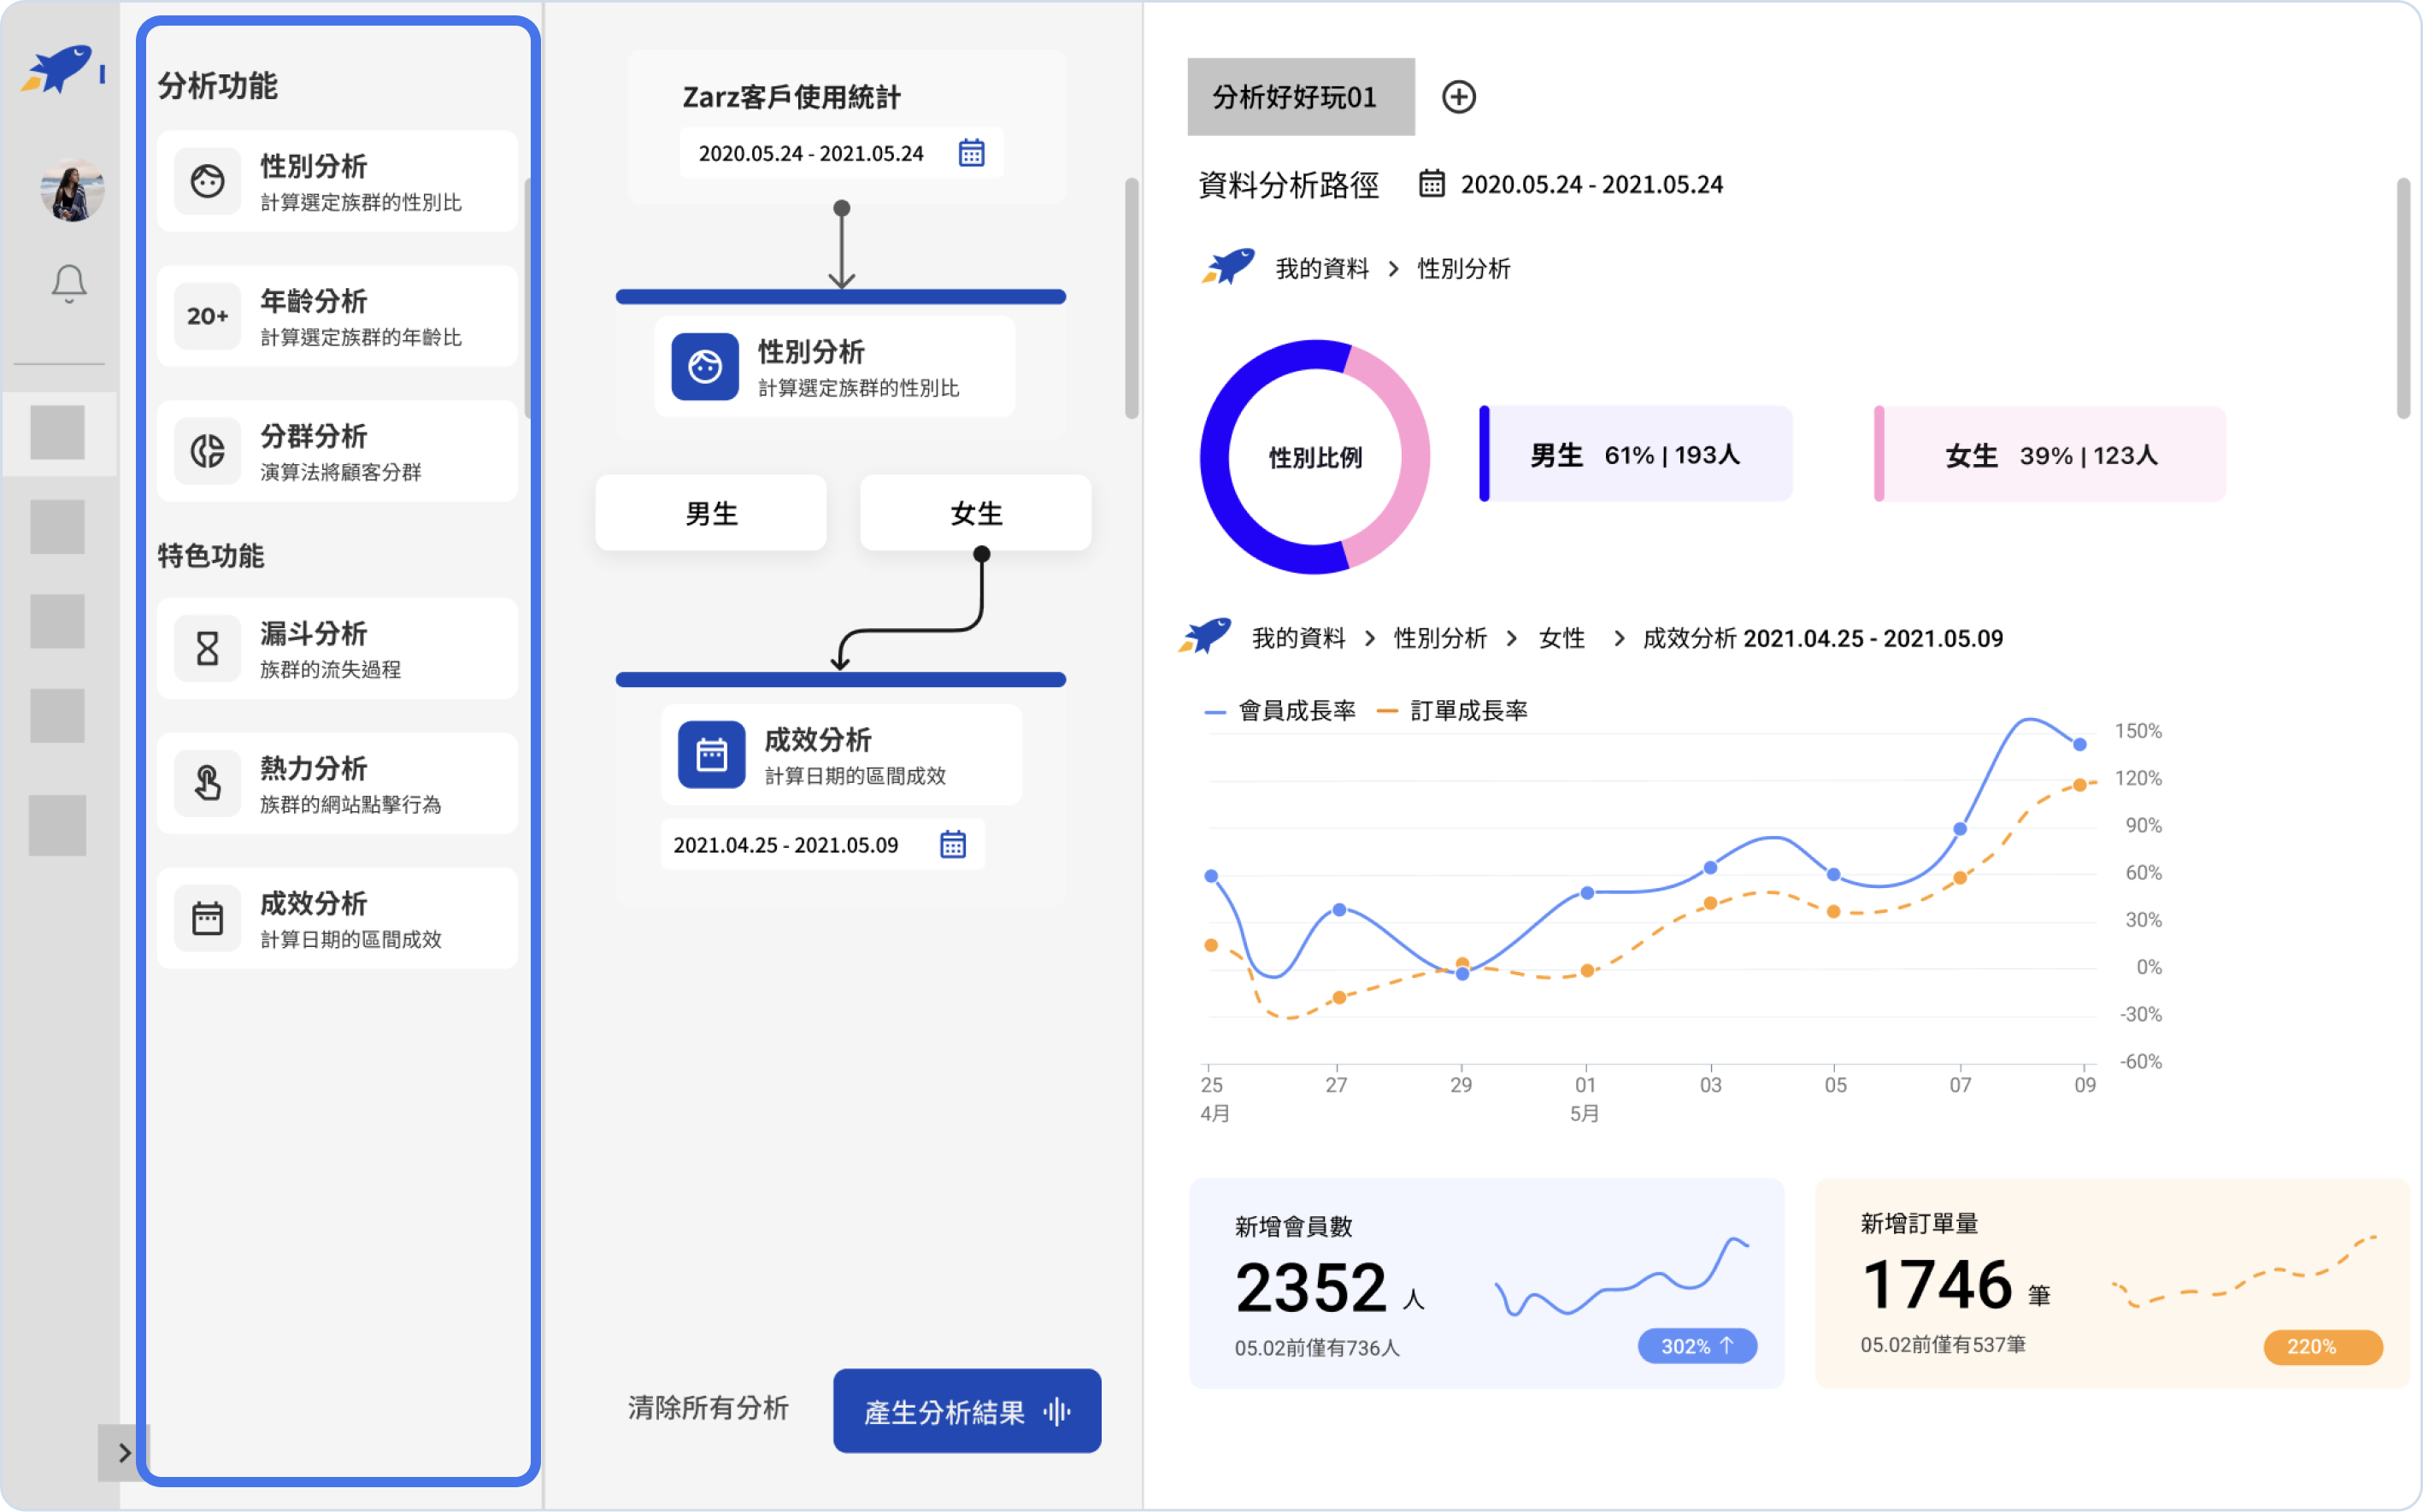
The current filters was not useful for exhibition industry users; they need to filter data by nationality, amount of consumption, etc.
UX
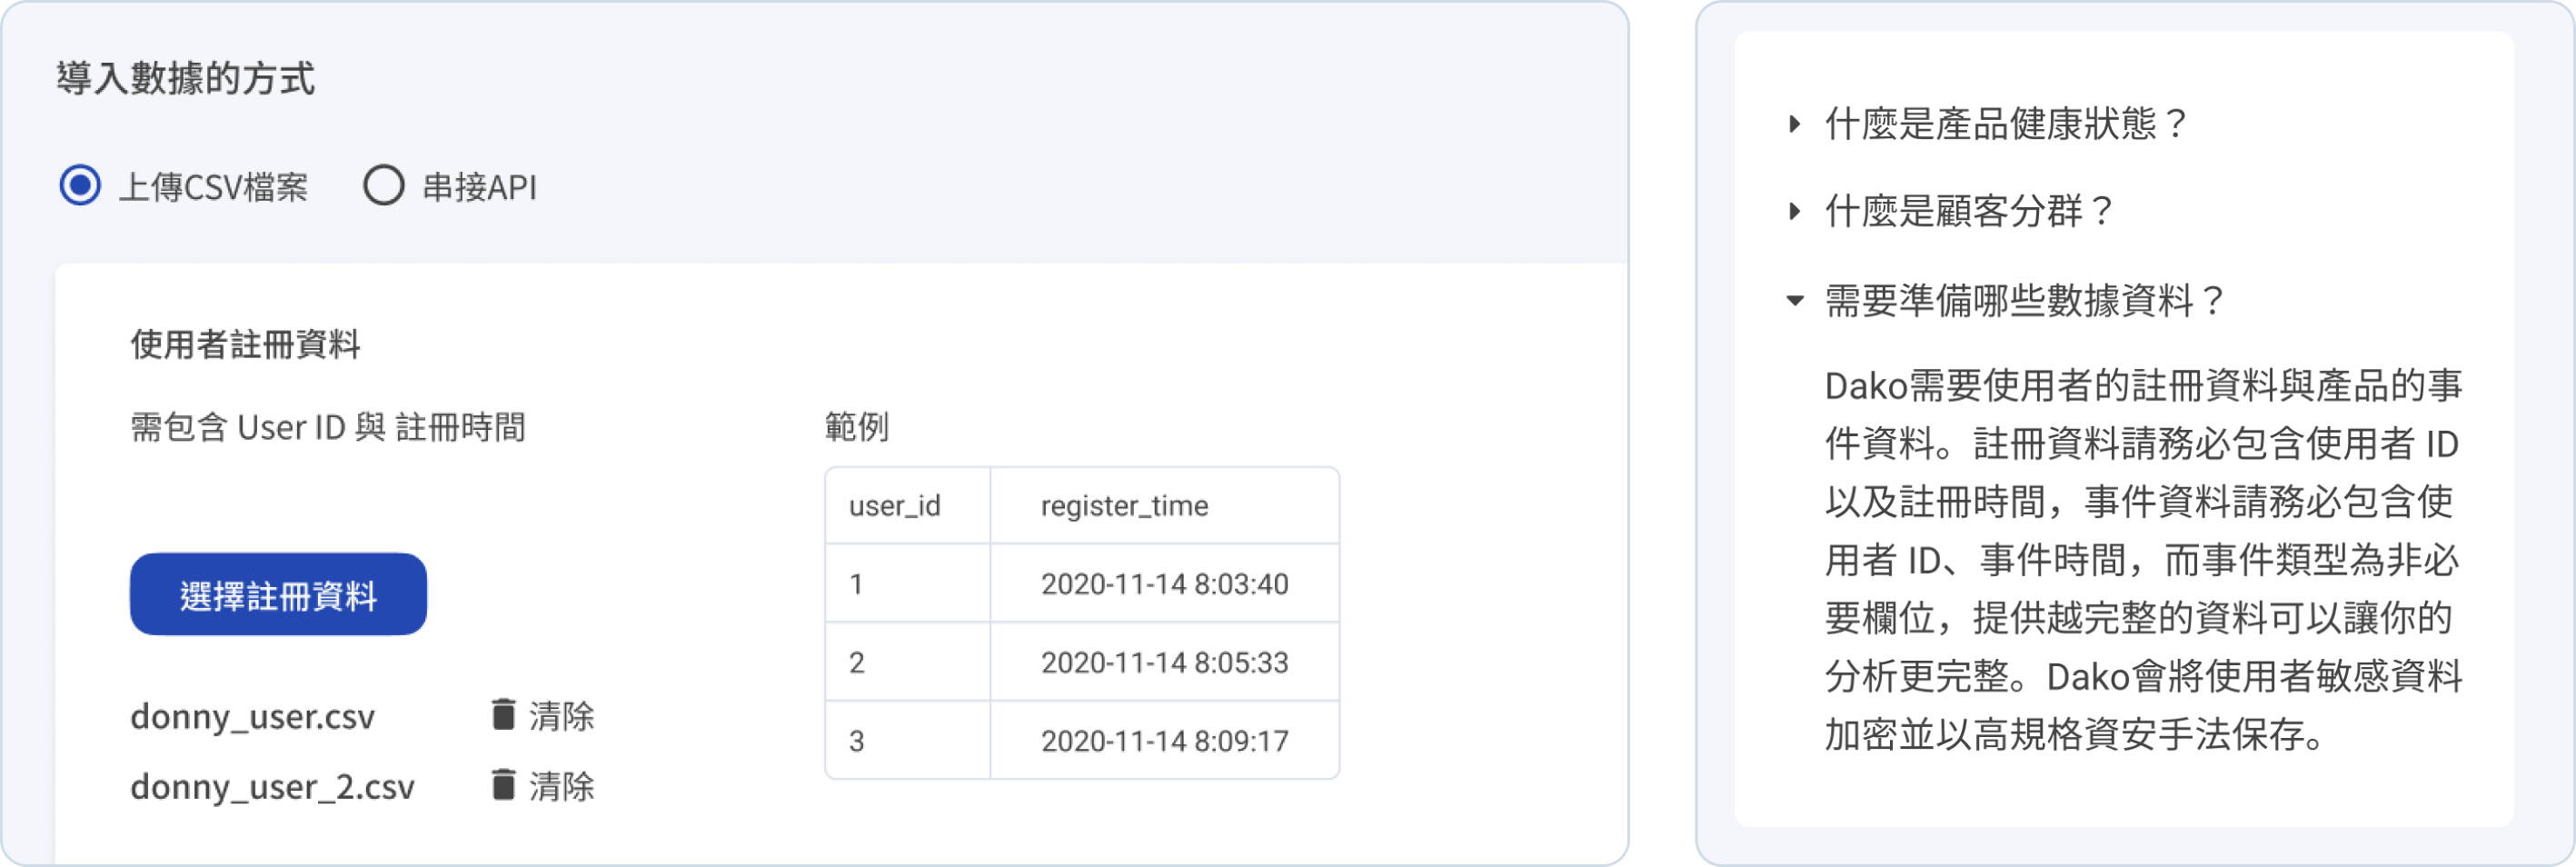
Confusing wordings at import data page stuck users.
UI
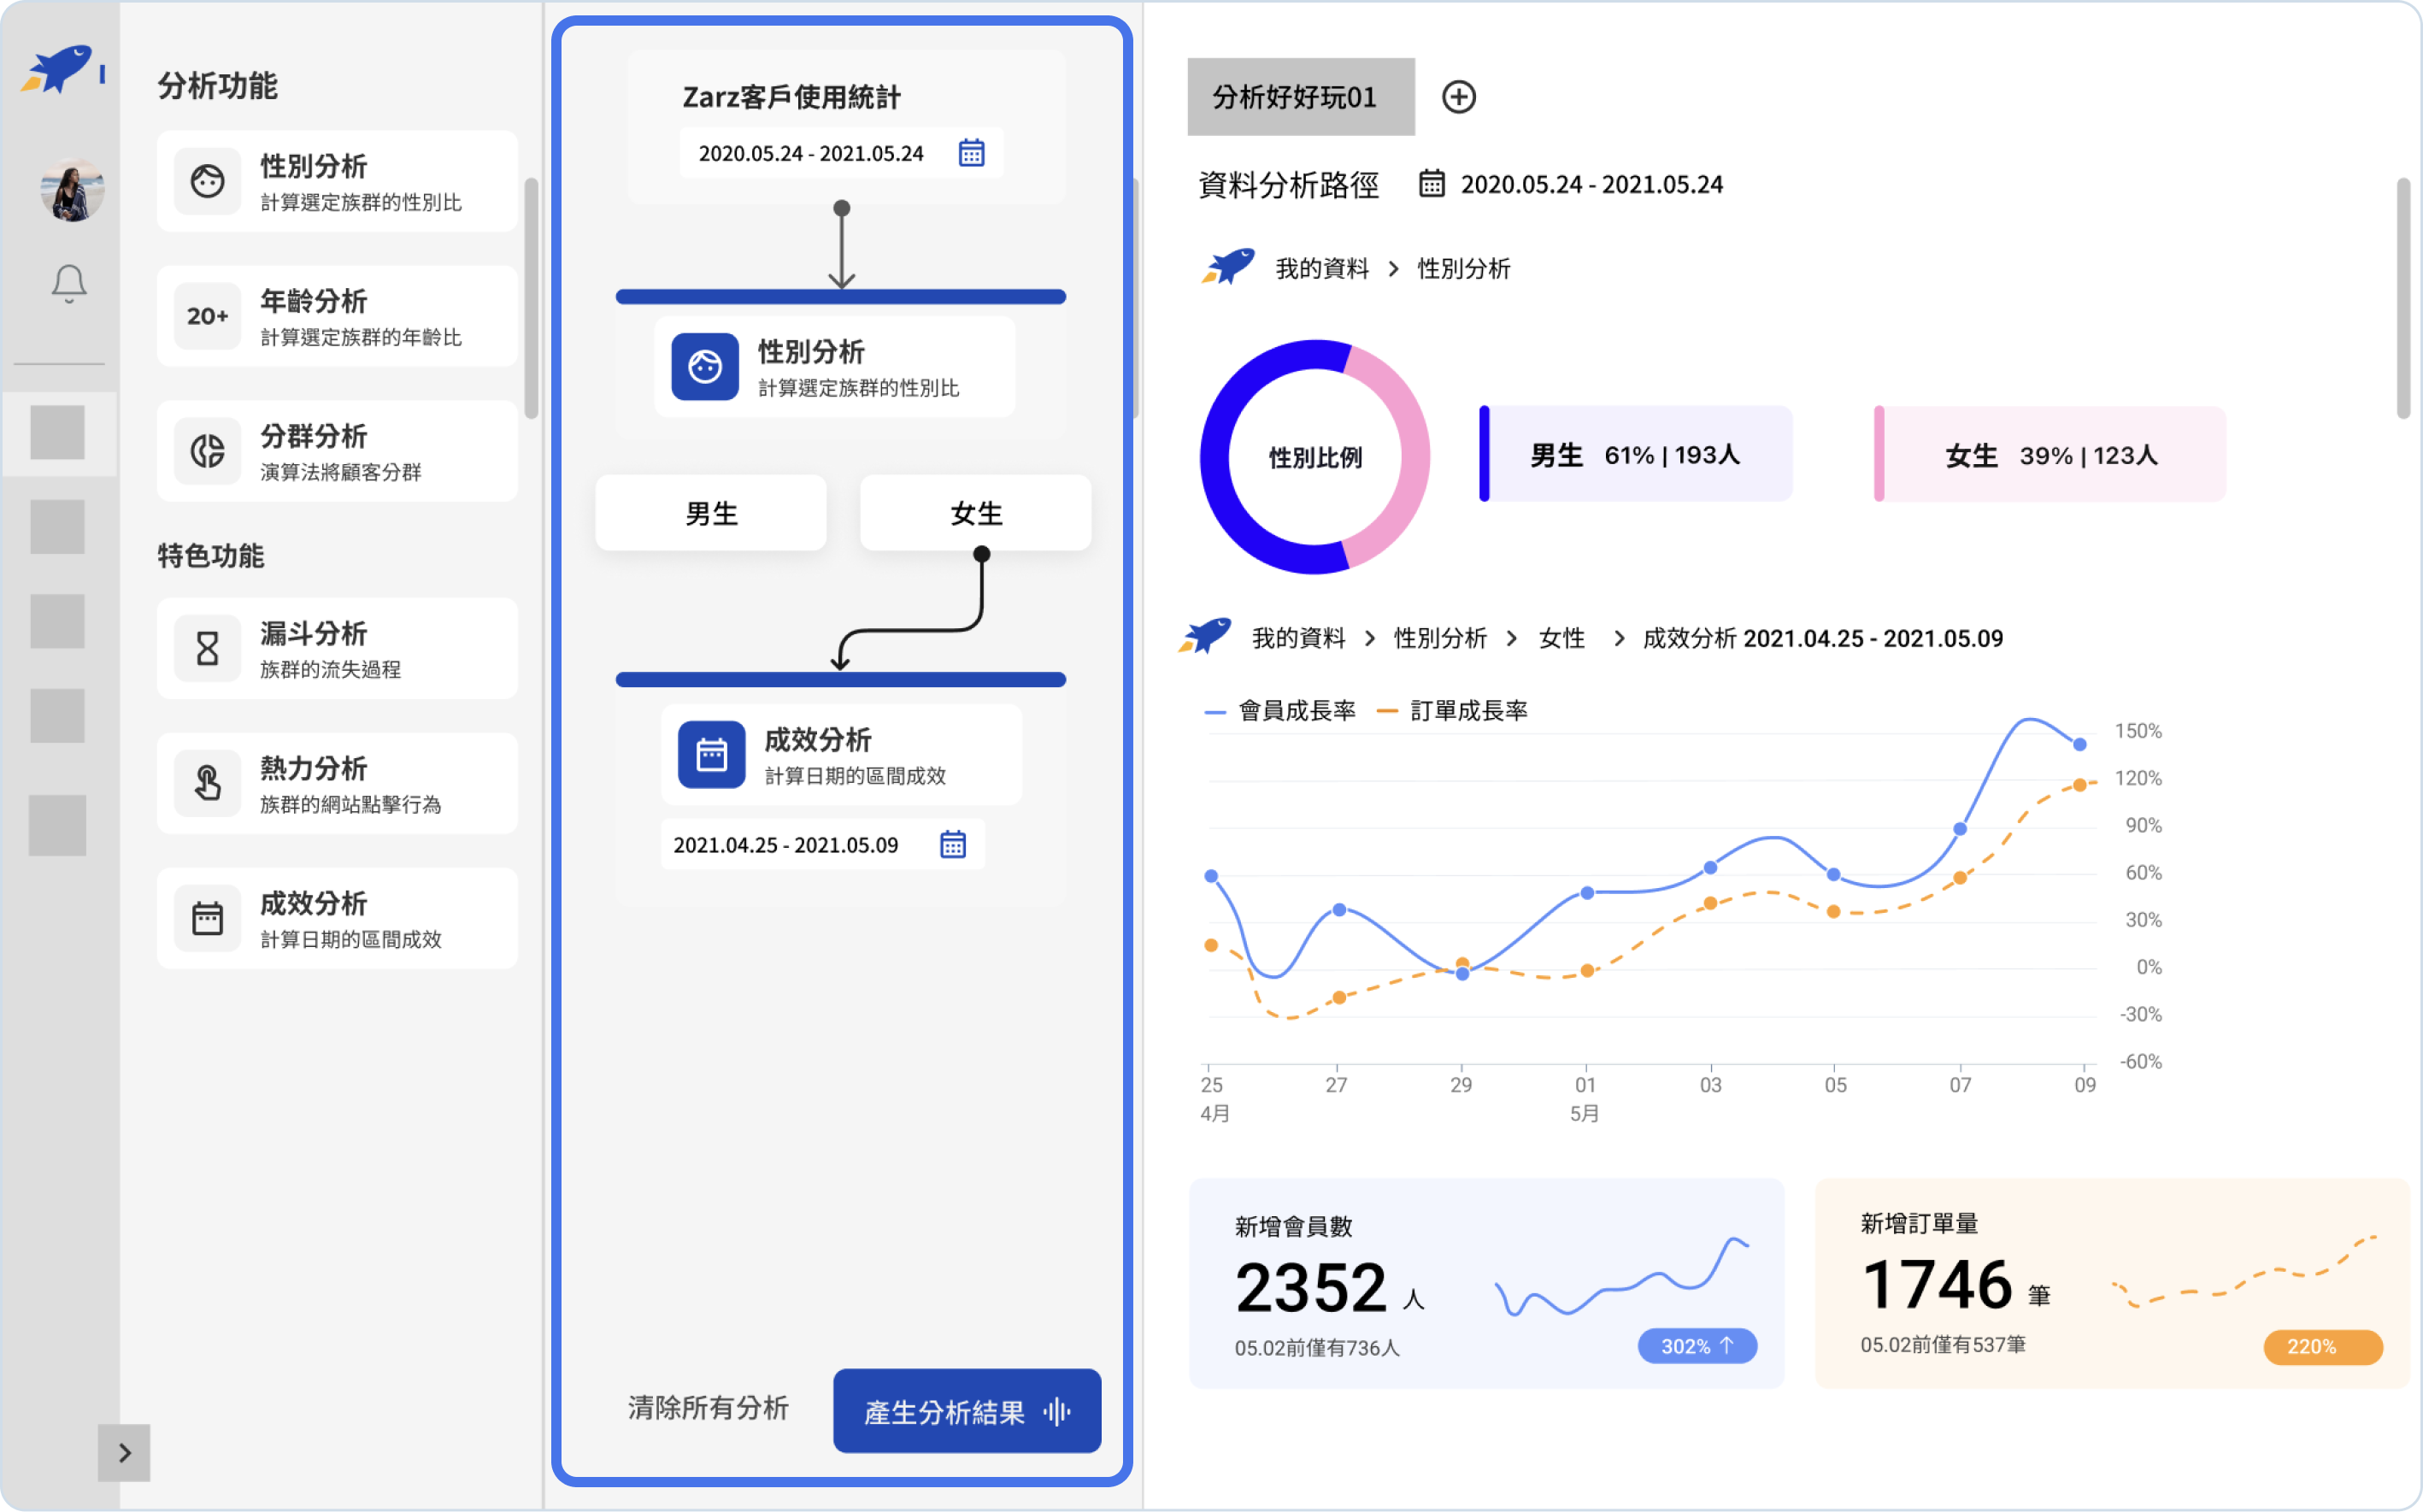
The layout of filter was only allow to show two results(male, female) at the same time which was not space utilization efficient.
Help exhibition industry users upload data without difficulty, filter data to find target clients easily and send emails to target clients efficiently!
Reduce confusing elements and improve the wording for uploading data page.
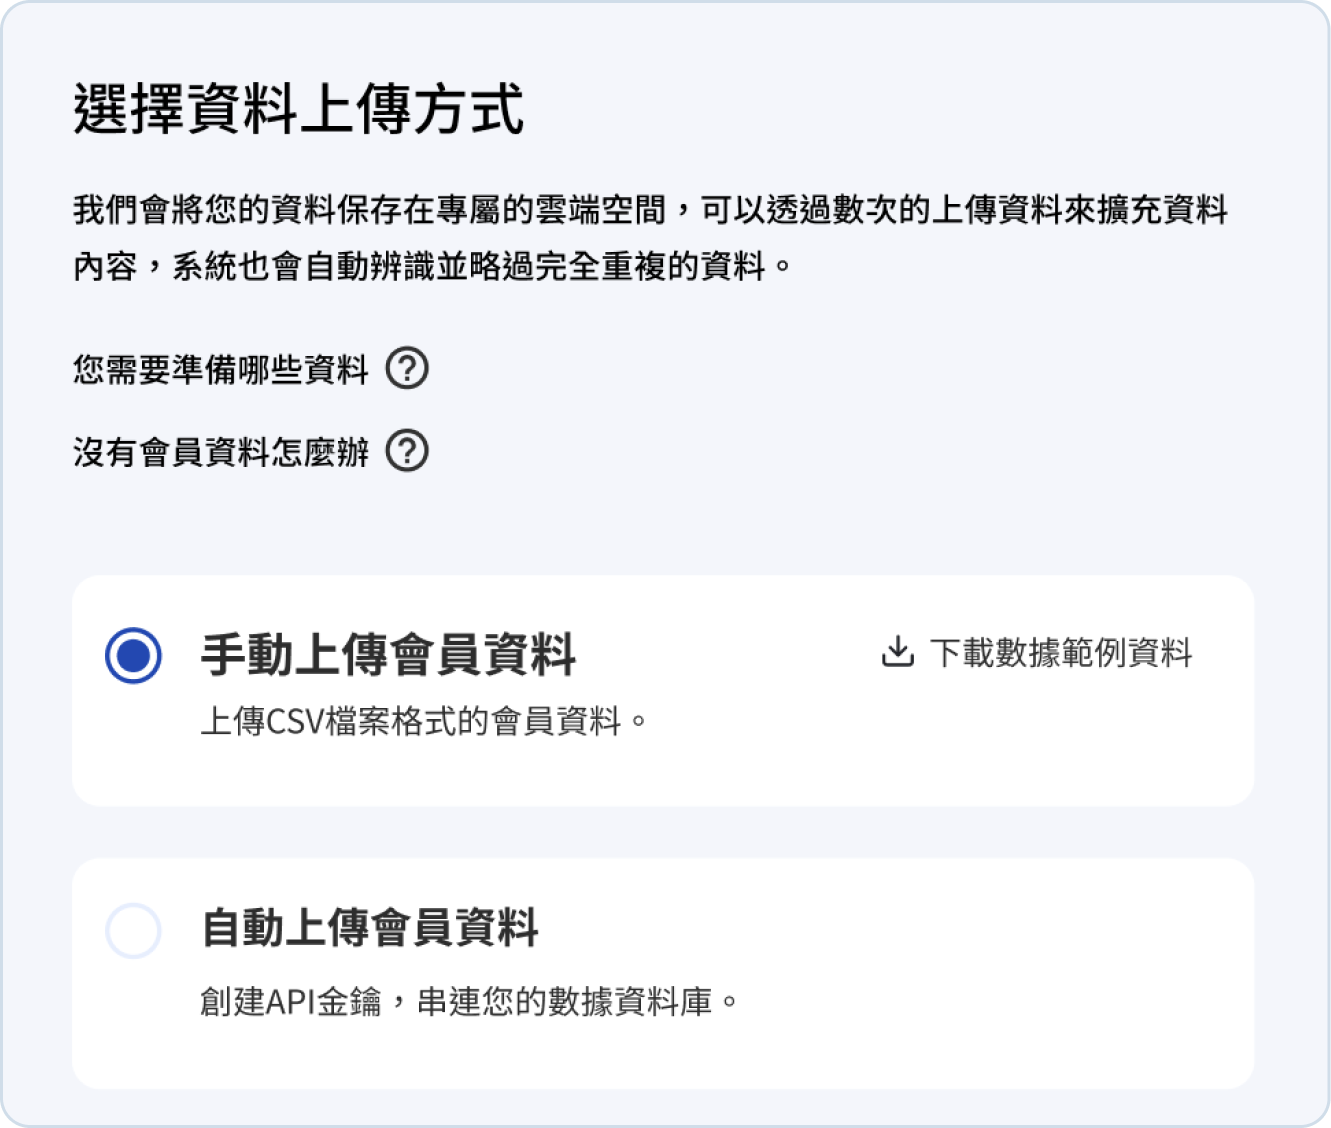
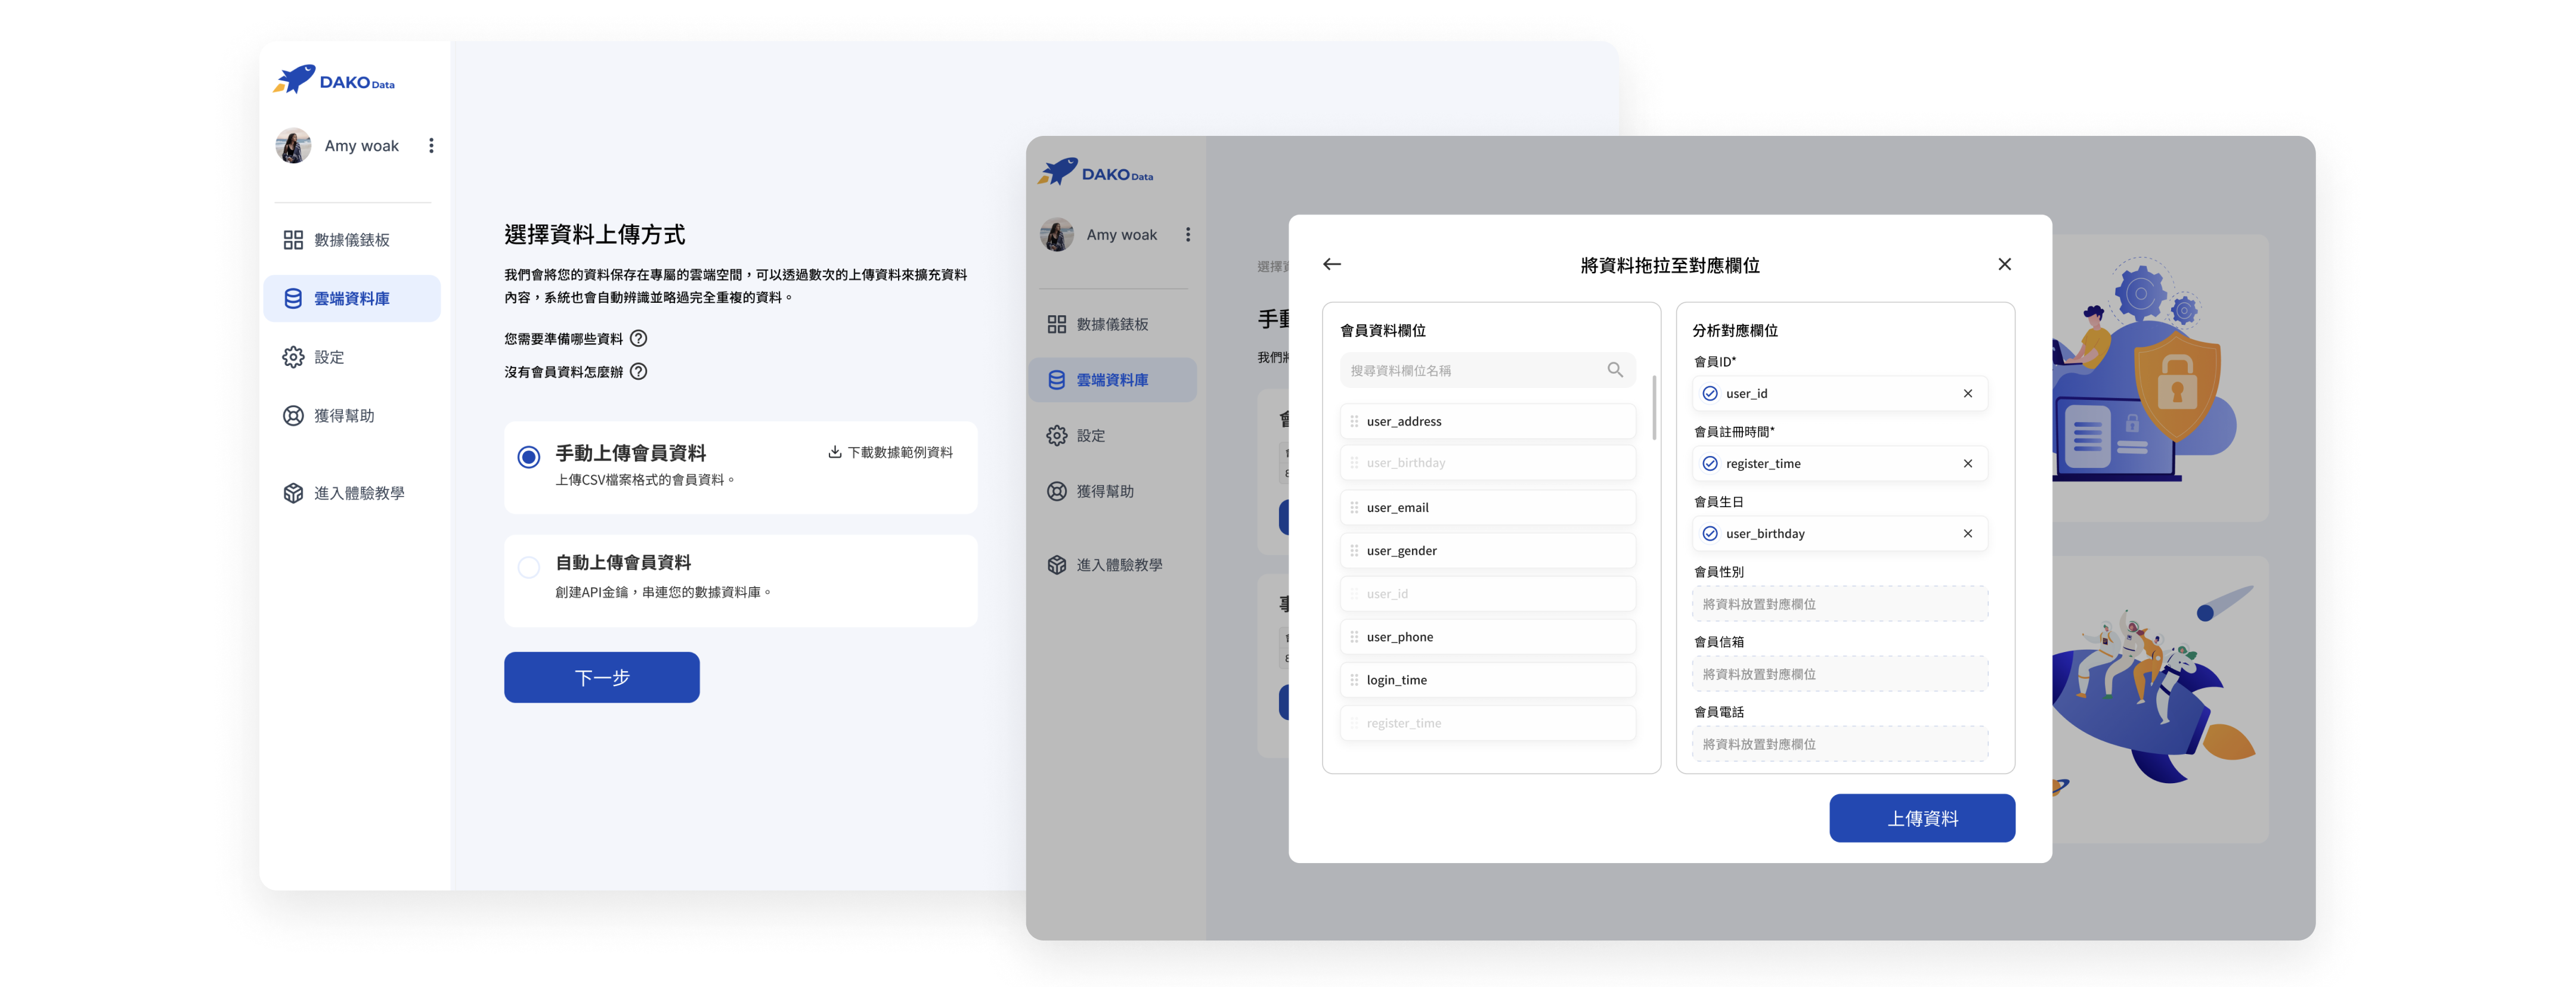
Users couldn’t understand the previous wordings and were confused about what’s API and the most significant difference between the two ways. The wording of the ways was changed from “Upload CSV file” to “Upload file manually,” and “Use API” was changed to “Upload data automatically.”
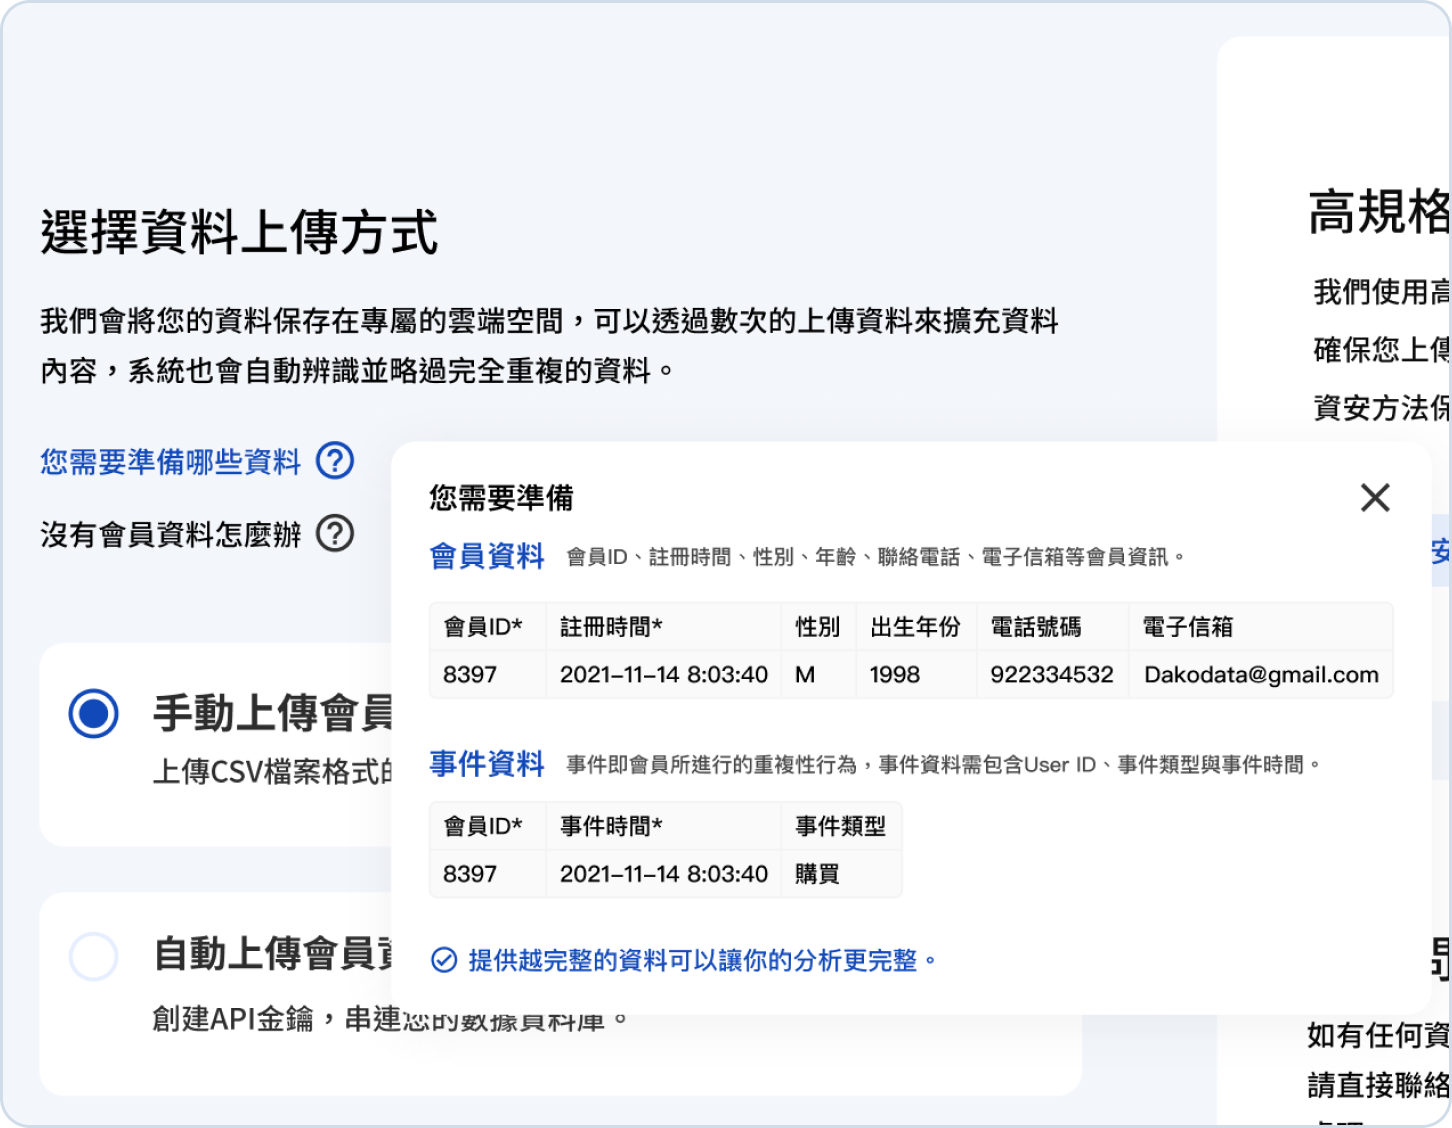
We provided the example and hiding it in tooltips to minimize the elements on the page. Users can check it by clicking the tooltip if necessary.
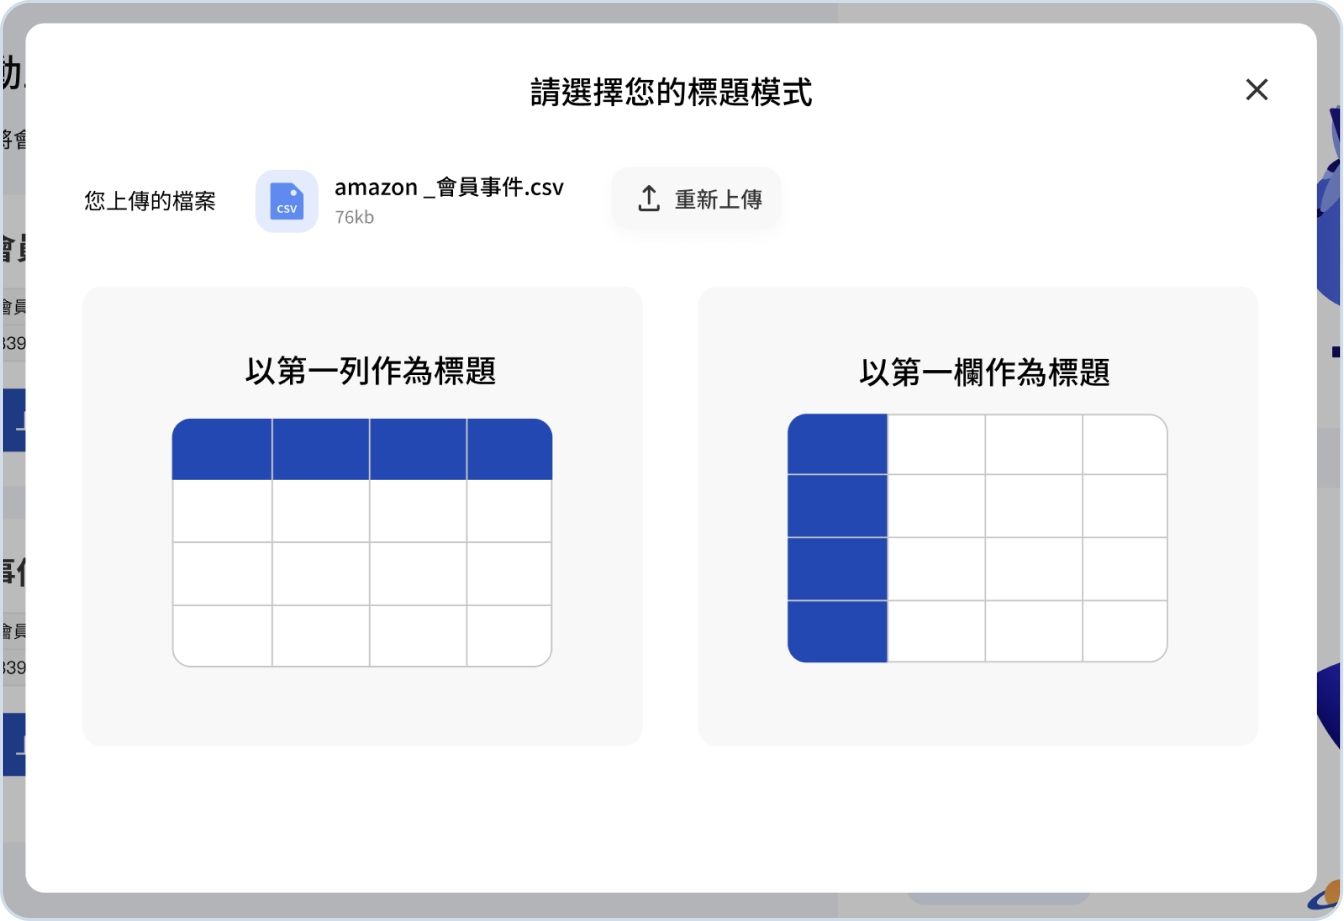
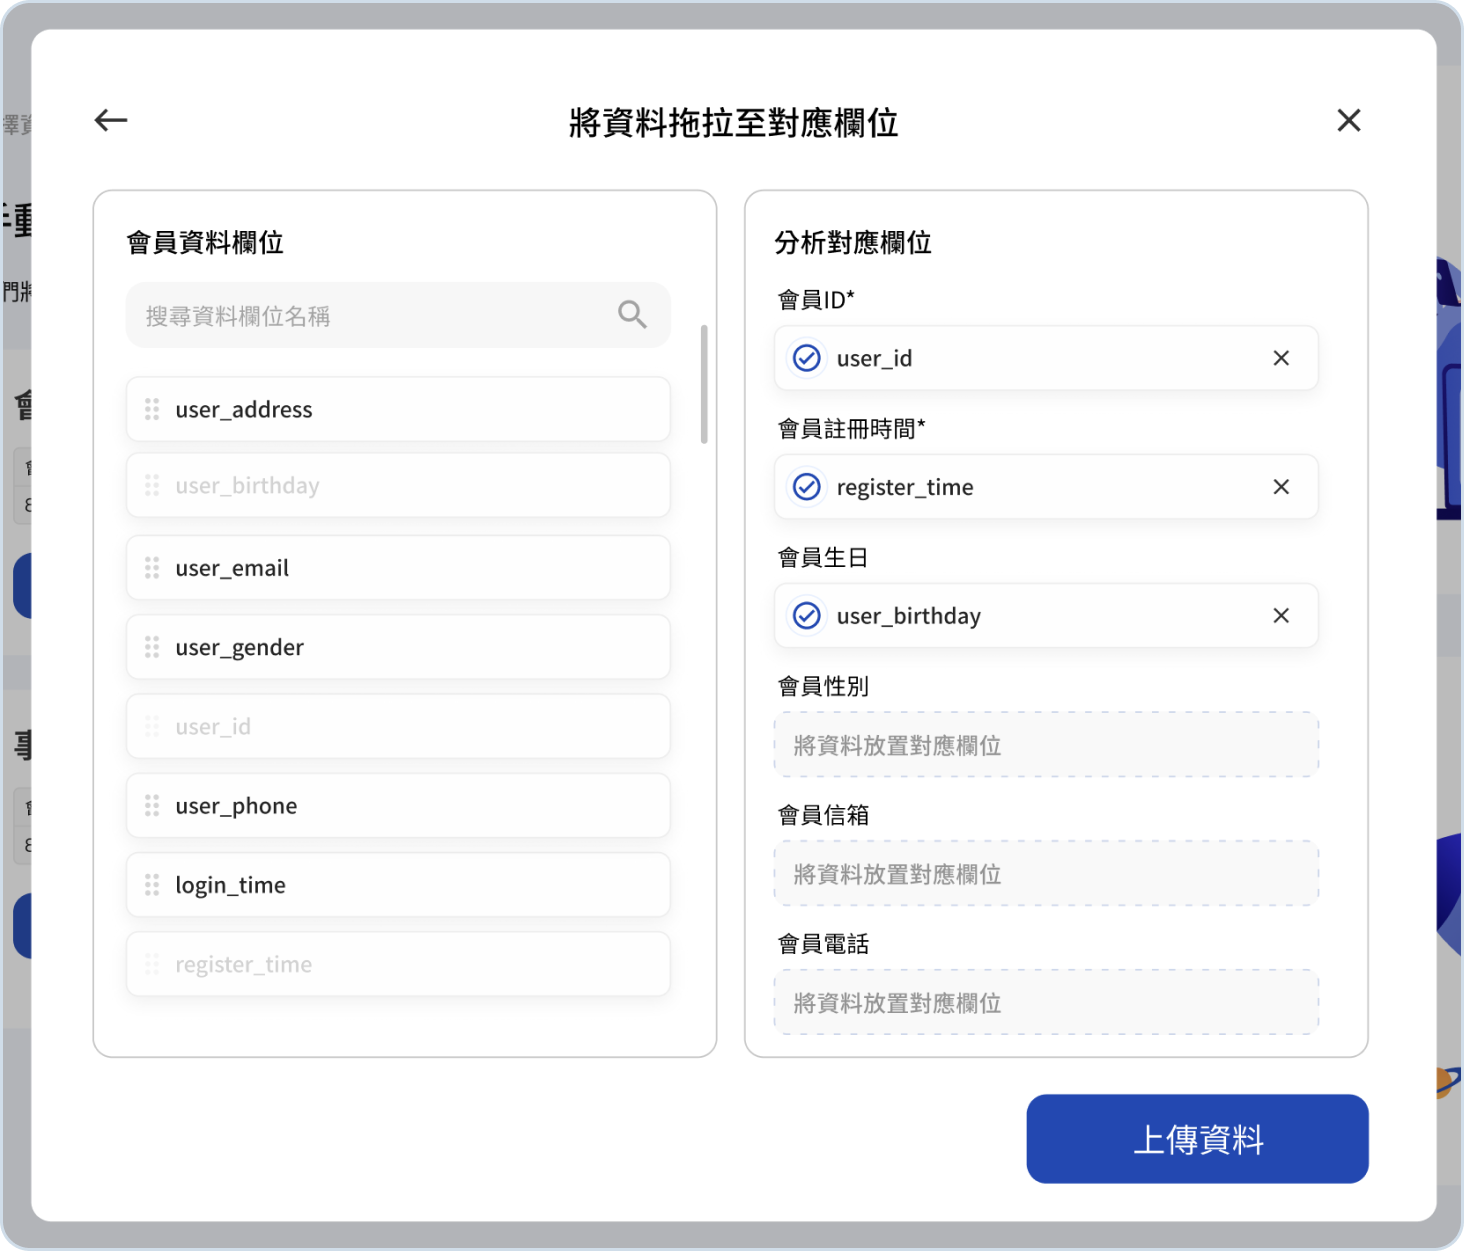
Allow users to adjust data in upload data flow for analysis accuracy.
Build users' trust with claim.
Filters for exhibition users scenario.
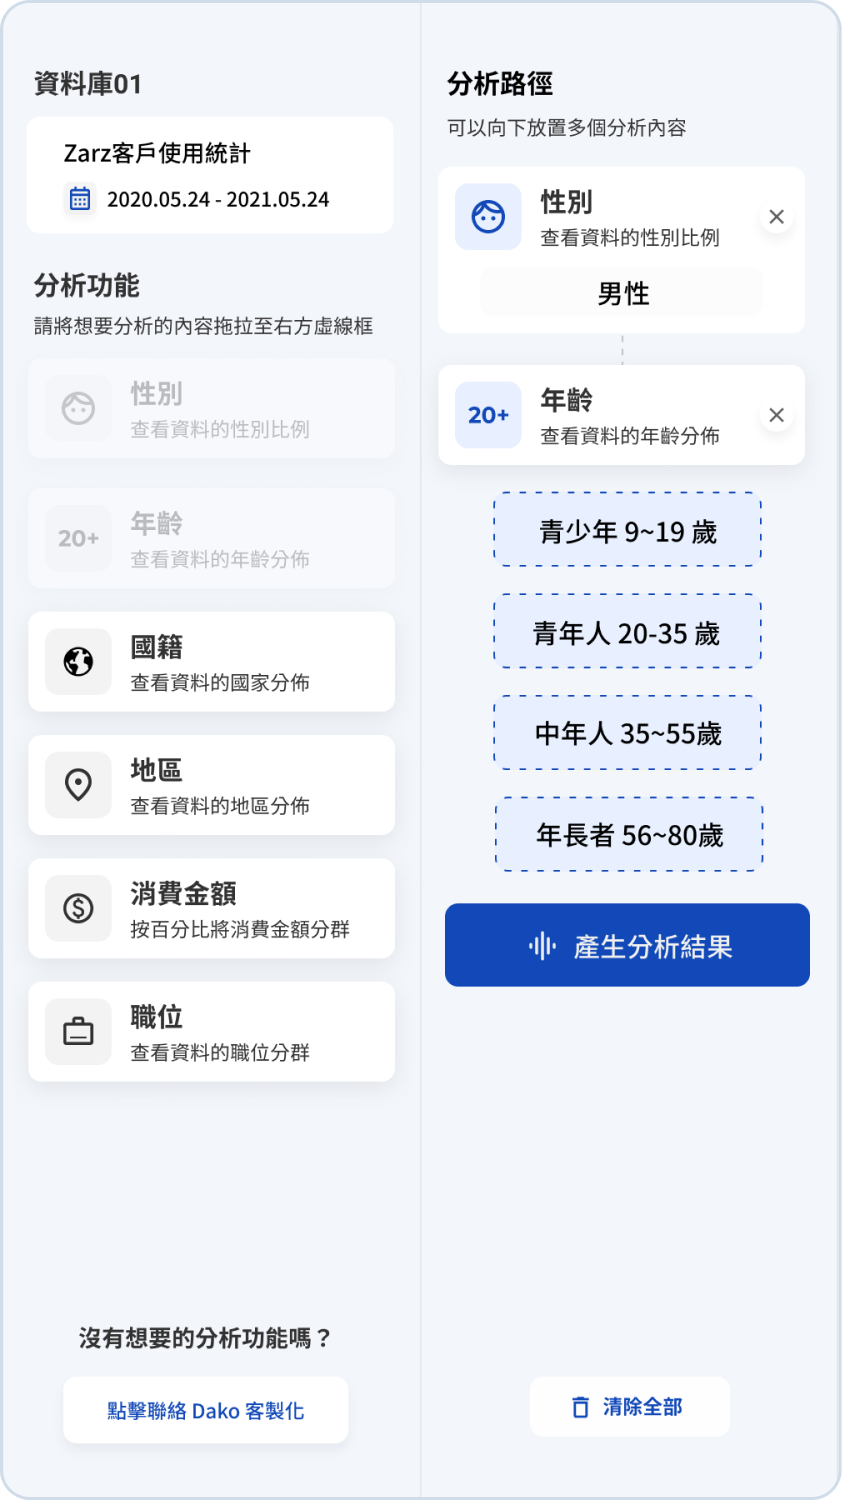
For users to take next action(send email) easily.